by Liz Ann Sonders, SVP, Chief Investment Strategist, Charles Schwab and Company
Key Points
- U.S. economic growth is strong; but it’s time to look at the signs we may be facing a “second derivative” change, or inflection point in growth.
- Complacency abounds—about growth, volatility, inflation and trade.
- Heed this: when it comes to the relationship between economic fundamentals and stock market behavior, “better or worse matters more than good or bad.”
This report may end up being the first in an ongoing series. I think of it as a “look inside my notebook,” as it literally represents a synopsis of the recent notes I put together for our latest Asset Allocation Working Group meeting. These represent a number of budding risks for the economy with which the markets are grappling. There are offsetting positives of course, but let’s leave this report to a look at some of the possible negatives.
Second that emotion
In particular, I will highlight some risks associated with “rate-of-change” or “second derivative” movements in indicators. These are directly tied to my long-held motto that when it comes to the relationship between economic fundamentals and the stock market, “better or worse tends to matter more than good or bad.” In other words, rate of change and inflection points matter more than levels.
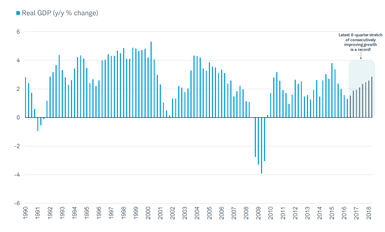
Let’s start with a positive actually, but one that begs the question: “Is this as good as it gets?” The U.S. economy has been accelerating for eight consecutive quarters—using the year/year growth rate of real gross domestic product (GDP) on a quarterly basis. Yes, it’s still not at a strong level relative to past peaks, but eight quarters with consistently accelerating growth from quarter-to-quarter has never happened before, as you can see in the chart below. The prior record was seven, coming out of the 1991 recession. Perhaps the streak continues, but I think there’s a risk that it will end in this year’s second half.
Record-Breaking Run for Accelerating Growth
Source: Charles Schwab, Bureau of Economic Analysis, FactSet, as of June 30, 2018.
Record-breaking expansion?
The U.S. economy is less than a year from having its longest-ever expansion; recently receiving a significant boost from fiscal stimulus, following years of monetary stimulus. But with the fiscal stimulus being a temporary booster, after which year-over-year growth comparisons become higher hurdles, and global growth potentially slowing, it’s time to grapple with a potential economic inflection point and implications for equity market performance.
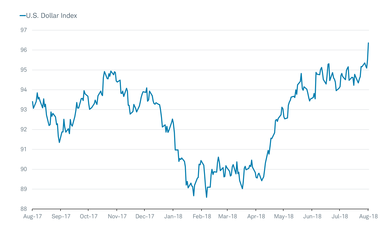
The rout across emerging market (EM) currencies is very typical after the percentage of EMs with above-average growth falls below 50% (it’s now at 47%), according to Bianco Research. In addition, the U.S. dollar has historically shot higher during similar slowing across EM economies. Slowing economic growth, coupled with a strong U.S. dollar, can be a recipe for heightened volatility across riskier asset classes.
Dollar on a Tear This Year
Source: Charles Schwab, Bloomberg, as of August 10, 2018.
Lending support to the view that growth will decelerate is the fact that the OECD U.S. Composite Leading Indicator fell in both May and June—suggesting that growth momentum eased toward the end of the second quarter. And the annualized six-month rate of change dropped to 0% after having been as high as 0.8% earlier this year.
Four phases of economy
I was taught early in my 32-year career about the impact of economic phases and monetary policy on market behavior. The best phases for the stock market are the initial two: accelerating growth/decelerating inflation followed by accelerating growth/accelerating inflation. But when moving into the third and fourth phases, stocks tend to struggle: decelerating growth/accelerating inflation followed by decelerating growth/decelerating inflation. My friend Keith McCullough at Hedgeye calls them “Quads” (believing we are on our way from Quad 2 to Quad 3) and points out monetary policy (MP) tendencies in each:
- Quad 1: neutral MP
- Quad 2: hawkish MP
- Quad 3: constrained MP
- Quad 4: dovish MP
Inflation complacency?
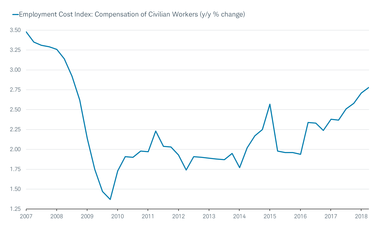
Markets may be overly complacent with regard to inflation picking up from here. Not only are most measures of inflation now above the Fed’s 2% target, measures of wage growth are picking up as well. The employment cost index—a preferred measure by many economists as it contains both wages and benefits—is at its highest reading since September 2008 as you can see below.
Employment Costs at Highest in Decade
Source: Charles Schwab, FactSet, U.S. Department of Labor, as of June 30, 2018.
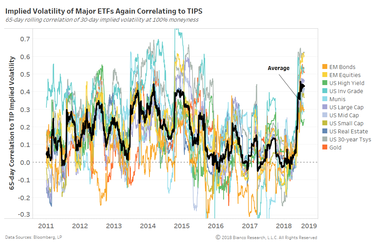
The Bianco Research chart below shows the rolling 65-trading day correlation between implied volatility for 11 major asset classes to U.S. Treasury inflation-protected securities (TIPS). Volatility, or perceived risks across asset classes, swiftly aligned with U.S. TIPS (i.e., real yields) beginning in May this year. Notes Bianco: “The low volatility of asset returns has very likely been perpetuated by all-time low volatility in inflation expectations. On the flip side, an eventual break-out of real yields and/or inflation expectations will rattle all asset classes.”
Most Asset Classes Directly Tied to Inflation/Real Yield
Source: Bianco Research, L.L.C., as of August 9, 2018.
Ignore money supply at your peril?
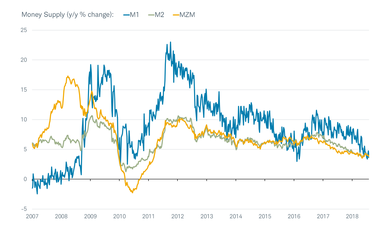
Another sign of slower growth likely coming is the drop in the growth rate of money supply (which lost the attention of many economists in this cycle). Perhaps these measures are no longer relevant in a post-quantitative easing (QE) world, but I’m not ready to dismiss them. The annual growth rates in all three key measures—M1, M2 and MZM (money of zero maturity)—are now below the 5.4% year/year growth rate of nominal GDP.
Dwindling Supply of Money
Source: Charles Schwab, FactSet, Federal Reserve, as of August 3, 2018.
Tariffs taking bite out of manufacturing optimism
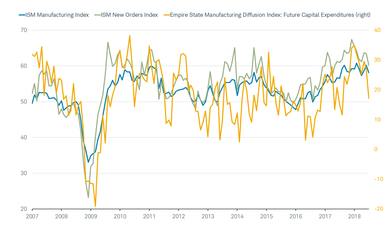
Back to the risk associated with trade and tariffs, notice the rolling over in the ISM Manufacturing Index—specifically the new orders component; which is more-than-matched by the drop in the Empire Future Capital Spending index. In other words, we are already seeing evidence that sentiment among corporate leaders is deteriorating—directly related to uncertainties around trade and tariffs.
Trade Taking its Toll on Manufacturing Sentiment
Source: Charles Schwab, FactSet, Federal Reserve Bank of New York, Institute for Supply Management (ISM), as of July 31, 2018.
Trade war to morph into currency war?
It’s worth considering whether the so-called trade war could morph into a currency war (or perhaps be accompanied by one). President Trump has mentioned exchange rate issues many times; including expressing a preference for a weaker dollar (which clearly has not been the case lately). Whether the administration ultimately intervenes in the foreign exchange (FX) markets is yet to be seen; but it would be an added risk associated with the ongoing trade battle.
As noted by Cornerstone Macro, the ammunition the United States could use in a currency war (currently $95 billion) pales in comparison to China’s (about $2 trillion). The U.S. Treasury has the legal authority to intervene in FX markets, using the Exchange Stabilization Fund (ESF) for that purpose. Some have opined that Treasury might ask for assistance from the Federal Reserve to add buying ammunition—requesting it use its considerable balance sheet to sell dollars and buy Chinese yuan. This is unlikely as the dollar is not part of the Fed’s mandate and would not serve any purpose with respect to its actual mandates of maximum employment and price stability.
Volatility unlikely to remain suppressed indefinitely
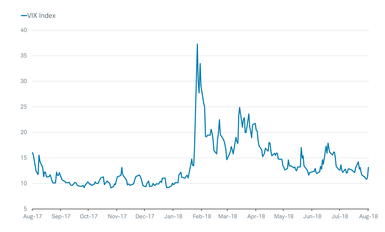
For now, U.S. market volatility remains quite low, but starting to move up off its recent low as we’ve expected it would do in light of myriad uncertainties; not least being trade and monetary policy. In fact, search trends for “monetary policy uncertainty” have recently spiked in the wake of Turkey’s currency turmoil.
Volatility Suppressed Again…For Now
Source: Charles Schwab, Chicago Board Options Exchange, FactSet, as of August 10, 2018.
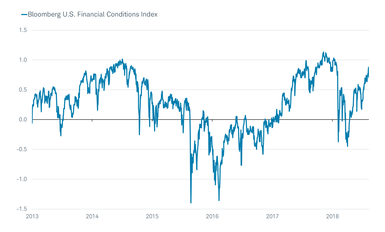
Also for now, financial conditions remain quite loose—in fact, they’ve recently loosened back to levels seen in advance of the February correction as you can see in the chart below. With the Fed likely to continue to tighten, we would expect a reversal in financial conditions in the not-too-distant future.
Financial Conditions Loose Again…For Now
Source: Charles Schwab, Bloomberg, as of August 10, 2018.
Consumers loving today…tomorrow, not so much
Consumers remain confident—however much more so about the present than the future. In the chart below, you’ll see a historically-wide gap has opened; which in the past has signaled heightened recession risk. Leading indicators and recession models still show recession risk as low, but they could escalate sooner than many believe—especially if we continue to head down the slippery slope toward a trade and/or currency war.
Consumers’ Love Affair with Present Not Matched by Feelings About Future
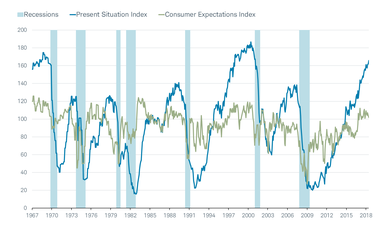
Source: Charles Schwab, FactSet, The Conference Board, as of July 31, 2018.
Better or worse matters more than good or bad
Investors have a tendency to focus more on the absolute than the relative. But inflection points in the data matter and stocks tend to sniff those out before it becomes obvious in the levels of the data. It’s growing more likely that an upcoming “second derivative” change in U.S. economic growth will be of the negative variety, which could mean today’s suppressed volatility will become a thing of the past.
Copyright © Charles Schwab and Company


