
Summer earnings season continues to roll along and for the most part, corporate reports and outlooks have been generally positive, confirming a strong US domestic manufacturing and service economy. To date, the most high-profile misses have been in areas exposed to trade tensions and a slowdown in social media user growth.
We’re moving into the later stages of reporting season now with the focus turning toward small and mid sized companies. This means that markets are less likely to be affected by reaction to results of one large cap, high weight, company and more influenced by the aggregate response to a large number of lower weight companies.
In this week’s edition of the Equity Leaders Weekly, we go back to the basics with a look at the Dow Jones Industrial Average and the Dow Jones Transportation Average. Dow Theory, named for Charles Dow and his work at The Wall Street Journal, dates back a century and is part of the foundation of Western Technical Analysis. Dow Theory has six main tenets but the one we will focus on this week is the relationship between the Industrials and Transportation Averages and what recent trends mean for the health of the underlying bull market.
Under Dow Theory, the Dow Industrials and Dow Transports should move in the same direction over time. Convergence supports a trend continuing, divergence suggest the potential for a reversal. In a growing economy the demand for goods and services increases (Industrials) along with the demand for shipping and travel (Transports), while demand for both decreases in a weakening economy.
Through 2017 both indices were in gear, confirming each others’ new highs. Since February, both indices have been consolidating. Recently, both indices have started to turn back upward, indicating that stocks may be preparing to resume their primary uptrend sometime later this year.
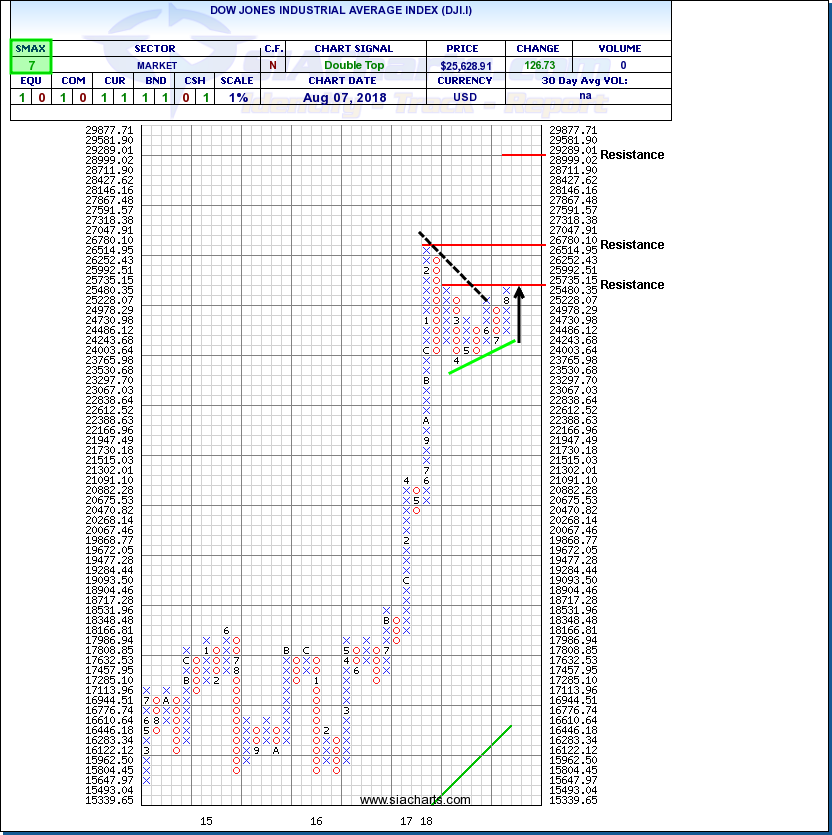
Dow Jones Industrial Average (DJI.I)
Following the 2016 US election, the Dow Industrials (DJI.I) went on a tear, soaring up from the 17,000s in November 2016 to the 26,000s by February 2018 with only one 3-box reversal speed bump along the way. A winter correction took the Industrials back toward 23500, but since then, accumulation has resumed as shown by the trend of higher lows in recent months.
Recently, the Dow Industrials have regained 25,225, completing a bullish Double Top and signalling the start of a new upswing. A break through 25,735 would complete a Spread Double Top, provide confirmation and opens the door to a potential retest of the previous peak near 26,780.
The large cap components of the Dow Industrials had struggled through the spring on fears that growing trade tensions could impact their sales and earnings prospects. Results from recent earnings indicate that companies oriented toward the strong US economy have continued to perform well, and among the multinational companies, producers of big ticket consumer items like appliances and autos have been impacted more to date than producers of small ticket items like personal products.
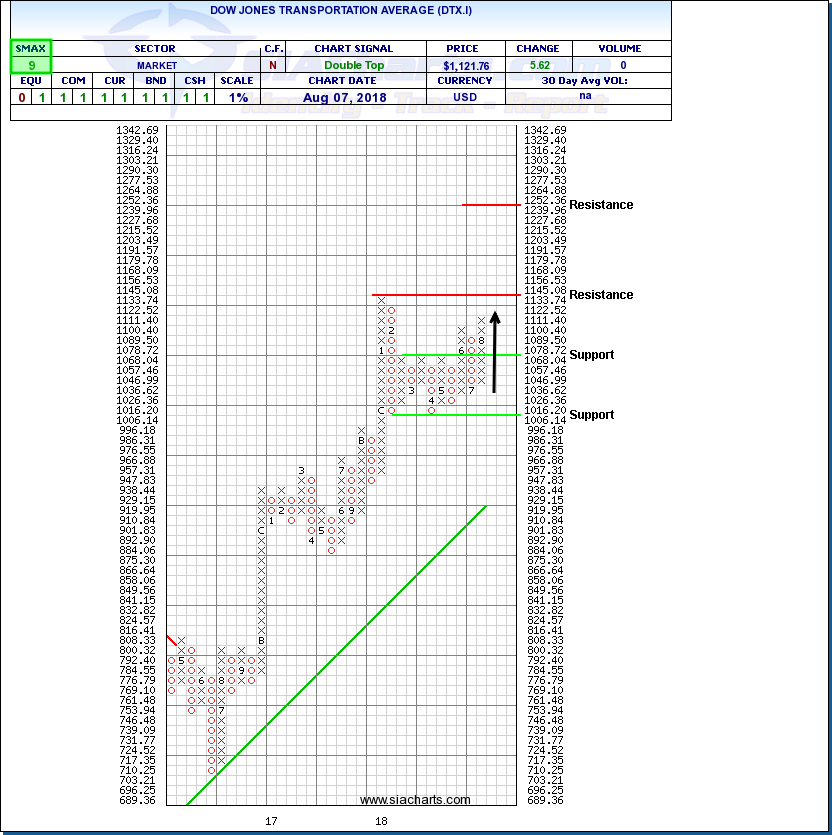
Dow Jones Transportation Average (DTX.I)
The Dow Transports also advanced between November of 2016 and January of 2018 but its advance unfolded somewhat differently. The main gains were made during two rallies, one that started in late 2016 and one that started in late 2017, with a larger consolidation phase in between. This lag may have been due to the Transport sector’s vulnerability to rising energy costs as the price of oil also trended upward through this period.
The winter correction in the Dow Transports tested but did not breach the 10,000 level and since then accumulation has resumed. The recent breakout over 10,787 completed a bullish Quadruple Top, signalling the start of a new upswing and since then, the index has continued to trend upward. The Dow Transports recently cleared 11,000 with next potential resistance at the previous peak near 11,450 then 12,525 based on a horizontal count out of the Quadruple Top.
A strong and growing US economy may continue to support demand for shipping and travel from consumers and businesses. Trade war fears have pushed down the prices of some commodities and caused energy prices to level off at least. WTI levelling off in the $65-$75/bbl range could stabilize or potentially ease cost pressures on transportation companies in the near term.
SIACharts.com specifically represents that it does not give investment advice or advocate the purchase or sale of any security or investment. None of the information contained in this website or document constitutes an offer to sell or the solicitation of an offer to buy any security or other investment or an offer to provide investment services of any kind. Neither SIACharts.com (FundCharts Inc.) nor its third party content providers shall be liable for any errors, inaccuracies or delays in content, or for any actions taken in reliance thereon.