


by Shane Obata, Craig Basinger, Chris Kerlow, Derek Benedet, Connected Wealth RichardsonGMP
Developed markets have largely recovered since the correction in Q1. Prices rebounded and so did confidence, giving way to a sense of calmness that is reflected in several depressed volatility indices. The fundamentals remain mostly positive; however, investors may have become somewhat complacent about market risks, a dangerous behaviour this time of the year.
Reasons for Optimism
Developed equity markets have recovered following a volatile first quarter that saw U.S. equities rise to record highs before correcting in late January, early February. One month into the second half of the year, the S&P 500 is back near record highs, the TSX is marginally higher and the Eurostoxx & Nikkei are just below cycle highs. The U.S. continues to lead the way higher but that is not surprising given the corporate and economic backdrop.
We are in the back half of what has been an impressive earnings season for U.S. companies. So far, 422 of 497 companies in the SPX have reported, with 71.5% beating on sales and 84.48% beating on earnings. In aggregate, these companies have reported sales growth of 10.13% and earnings growth of 25.13%, which is the highest reading since Q4’10 (see S&P 500 earnings season chart).
The U.S. economy is also firing on all cylinders. In Q2, GDP growth came in at a whopping 4.1% year over year (YoY), which was the highest print since Q3’14. In addition, inflation is ramping up and the labor market remains tight. The CPI reached 2.9% in June for the first time since Q2’ of 2012 while unemployment remains at the lowest levels in more than a decade.
The above statistics are impressive; however, the goal of investing is to look and position for the future. That raises the question: Are the best times behind us?
Tax cuts have lifted earnings but perhaps their effects will wane going forward. While Q2 GDP was solid, a look beneath the surface reveals multiple temporary enhancements that may not help as much going forward. “Legislation” (i.e. fiscal stimulus, tax cuts, etc.) added 0.8% to GDP growth while Chinese pre-purchases of soybeans ahead of tariffs added another 0.6%. All in, “base growth” was only 2.7%, which is not spectacular.

Reasons for Concern
The markets seem calm despite multiple risks looming on the horizon. The first one is quantitative tightening (QT), the reverse of quantitative easing (QE), the policy that is widely believed to have supported global markets for years.

QE worked mainly through the portfolio allocation channel. By removing Treasuries from the market, the Fed enticed investors to seek out riskier assets such as equities and credit. Now the reverse is happening (see Fed Balance Sheet chart). The Fed is stepping away from the market just as the Treasury is increasing issuance to fund higher fiscal spending. That is why the path of least resistance for rates is higher. If rates move high enough then we could see portfolio flows reverse. That is: we could see money flow out of riskier assets and into Treasuries.
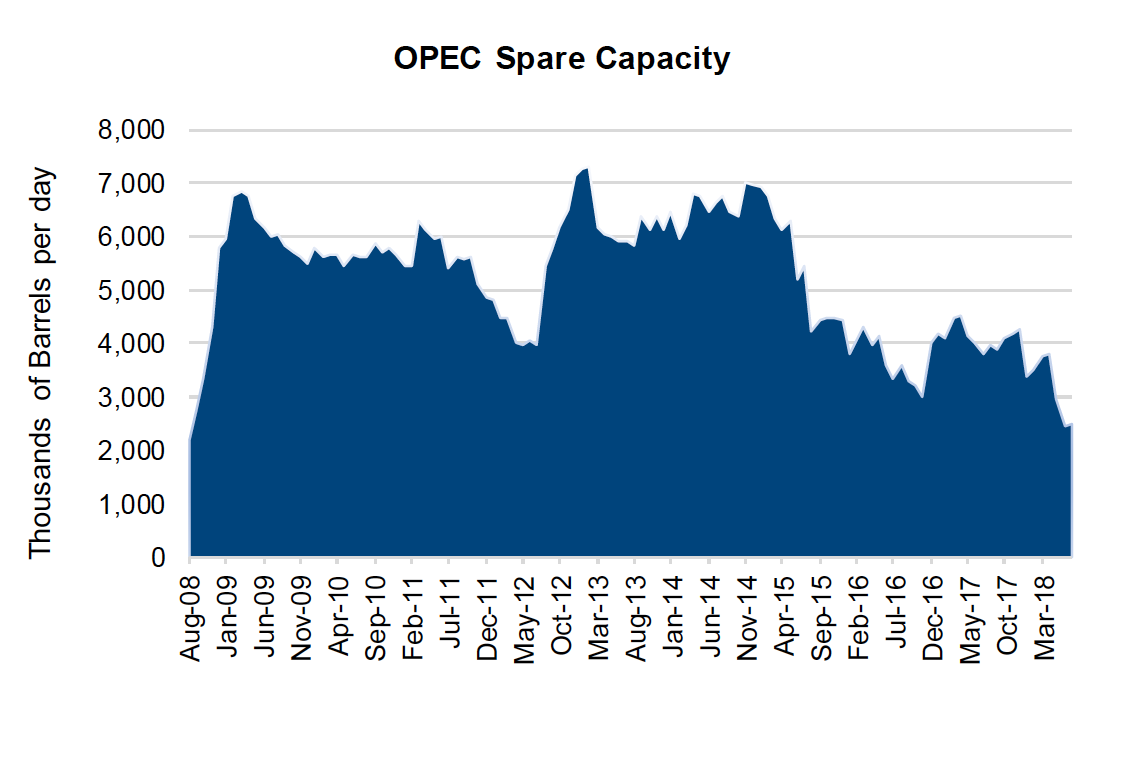
Low oil prices were not kind to Saudi Arabia and Russia. That said, higher oil prices could have similar effects on oil consumers. We are far away from the downturn experienced in late 2014 and early 2015. OPEC and its allies came together and reduced output, bringing us closer towards balance. Now many of the levers have been pulled and the risks are skewed to the upside.
Commercial inventories are back to “normal” levels, OPEC spare capacity is very low especially after the recent 1 million bpd increase (see OPEC Spare Capacity chart) and short-cycle U.S. production is in full swing. In addition, future supply has been compromised by the downturn in investment that took place during the oil doldrums. That leaves consumer demand as the last lever to improve the supply/demand balance and to rebuild stocks and spare capacity. Said another way: it may take higher prices to reduce consumption and incentivize investment.
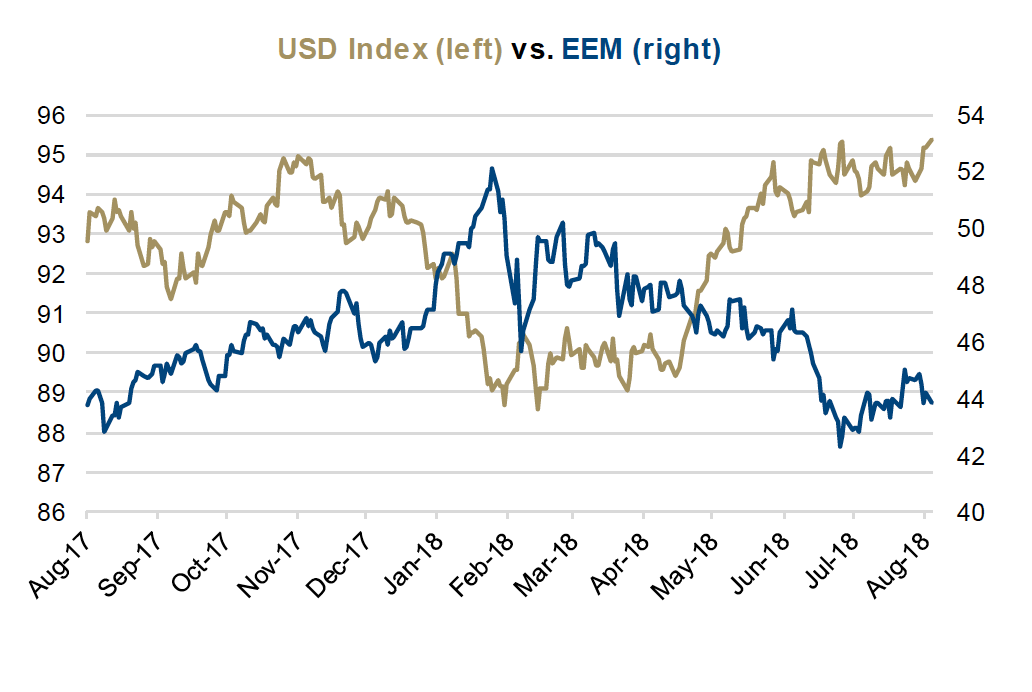
While developed markets have enjoyed some tranquility, the same has not been true for the emerging markets (EMs). The return of the Dollar King (a stronger U.S. dollar) has been weighing on the EMs. The U.S. dollar (USD) Index is +7.5% while EEM, the iShares Emerging Market ETF, is -15.6% since late January (see USD vs EEM chart). Further weakness in the emerging markets could spill over into developed markets, especially if we have another China growth scare.

The combination of a strengthening USD and rising trade tensions have pushed the Shanghai Composite down -21.1% YTD. It seems that trade negotiations between the U.S. and the EU are improving. Unfortunately, relations between the U.S. and China are getting worse. The Trump administration recently announced that it is considering increasing the rate of proposed tariffs to 25% (from 10%) on $200 billion worth of Chinese goods. There are also concerns that China’s deleveraging campaign could lead to slower growth in the near term. For example, China’s shadow banking social financing growth just turned negative for the first time since Q3’16 (see China Shadow Banking Social Financing chart).
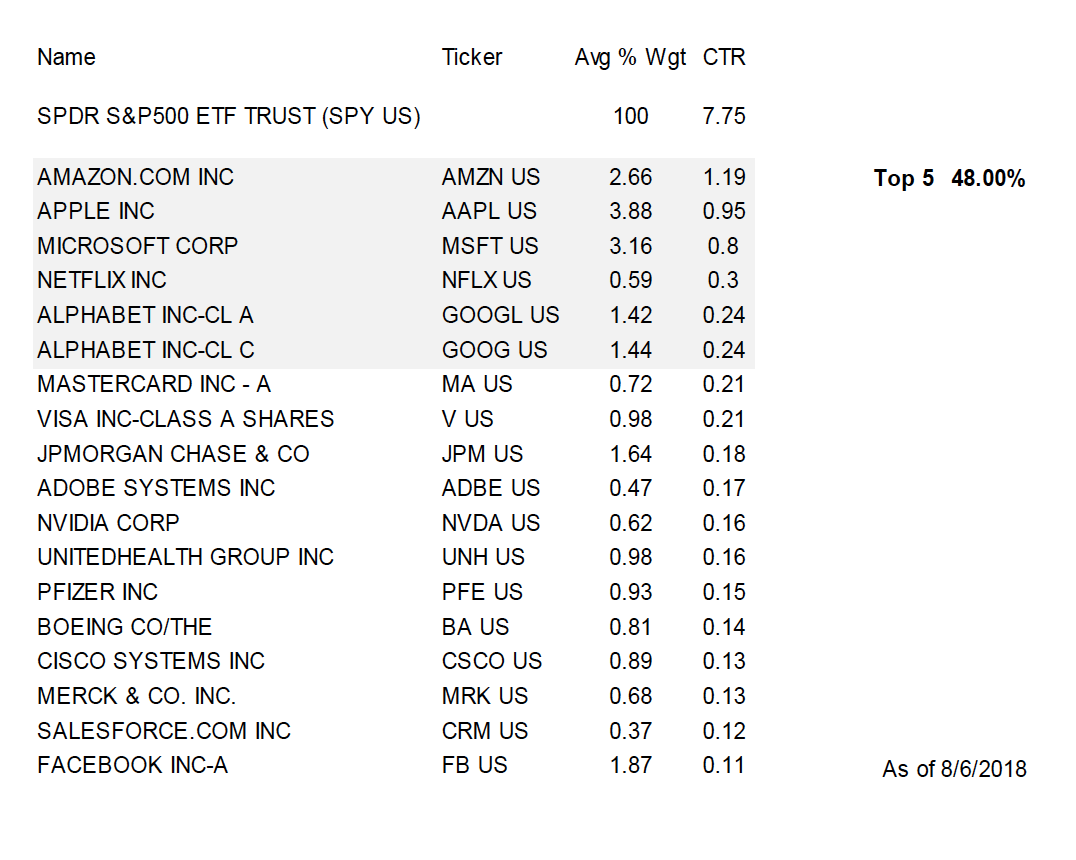
The tech titans, aka FANGMAN, have shown great leadership in this bull market. That is not a bad thing; however, too much concentration is. The S&P 500 has returned 7.75% YTD. Of that amount, 48% is attributable to Amazon, Apple, Microsoft, Netflix and Alphabet (see FANGMAN chart). This kind of reliance on a small number of stocks makes the markets vulnerable. If we see a reversal in technology stocks then risk appetite could quickly shrink.
Portfolio Implications
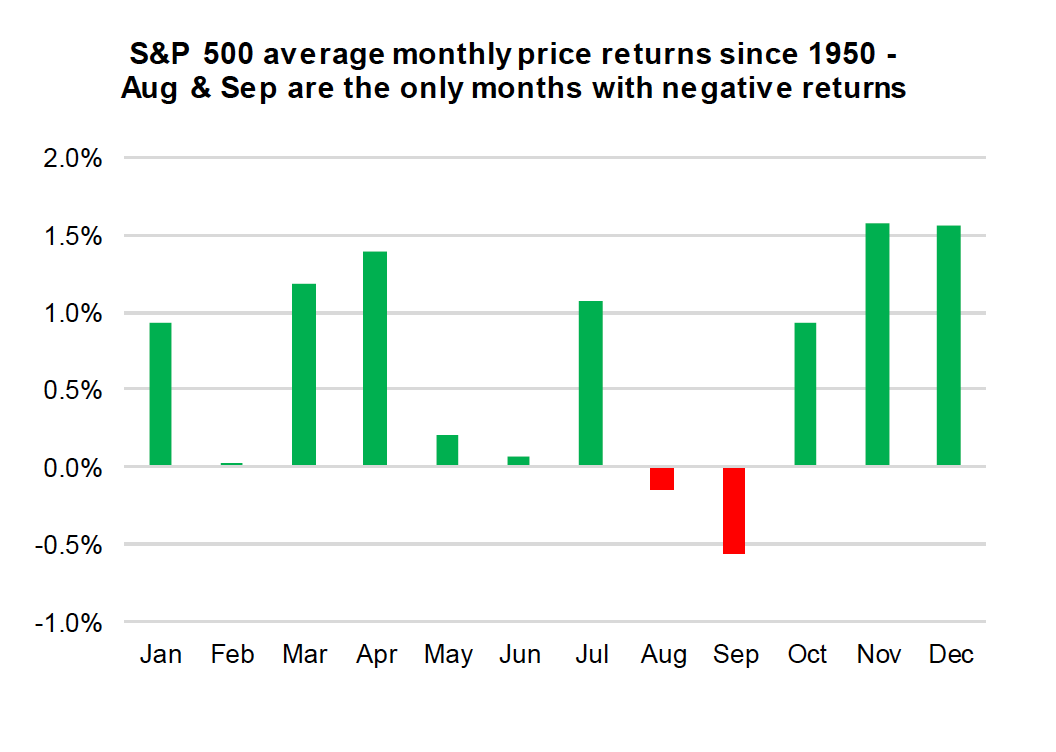
We are now entering what has been a historically bad period for equities. Since 1950, August and September are the only months with negative average returns (see S&P 500 average monthly price returns chart). That alone is not enough to make us worried; however, given that any of the above risks could lead to a market downturn and to higher volatility, we believe that it is probably a good time to focus on defense.
We remain positioned for higher equity prices. That said, we acknowledge that managing the eventual shift from cyclical to defensive equities will be a key determinant of forward returns.

Volatility is relatively low (see Cross Asset Volatility chart); but, hedging is not as cheap as this would imply. Investors are paying up for protection, as indicated by the elevated CBOE Skew Index. Even so, we recently added to our portfolio insurance in BHAV. In this case, we would rather pay a premium for protection than leave ourselves exposed to real risks that other investors are ignoring.
*****
Charts are sourced to Bloomberg unless otherwise noted.
This publication is intended to provide general information and is not to be construed as an offer or solicitation for the sale or purchase of any securities. Past performance of securities is no guarantee of future results. While effort has been made to compile this publication from sources believed to be reliable at the time of publishing, no representation or warranty, express or implied, is made as to this publication’s accuracy or completeness. The opinions, estimates and projections in this publication may change at any time based on market and other conditions, and are provided in good faith but without legal responsibility. This publication does not have regard to the circumstances or needs of any specific person who may read it and should not be considered specific financial or tax advice. Before acting on any of the information in this publication, please consult your financial advisor. Richardson GMP Limited is not liable for any errors or omissions contained in this publication, or for any loss or damage arising from any use or reliance on it. Richardson GMP Limited may as agent buy and sell securities mentioned in this publication, including options, futures or other derivative instruments based on them.
Richardson GMP Limited is a member of Canadian Investor Protection Fund. Richardson is a trade-mark of James Richardson & Sons, Limited. GMP is a registered trade-mark of GMP Securities L.P. Both used under license by Richardson GMP Limited.
Connected Wealth RichardsonGMP © Copyright 2018. All rights reserved.