
by John Lynch, Chief Investment Strategist, LPL Financial
KEY TAKEAWAYS
- For a number of reasons, over the past several years it’s been difficult for active managers to outperform equity benchmarks.
- The tide has started to turn, with central banks pulling back, lower correlations between individual stocks, and an evolving economic environment.
- We believe active managers may be set up for better relative performance opportunities in the coming years.
Active management may be poised for a comeback. During the past several years, it’s been difficult for active managers to outperform equity benchmarks. There are a number of reasons for that, including the strength of the market, market distortions from central bank bond purchases, and high correlations between stocks. However, the tide has started to turn, which we believe sets active managers up for better relative performance opportunities in the coming years.
MANAGER CONDITIONS ARE IMPROVING
Several of the market conditions since the financial crisis that have presented headwinds for active managers are starting to abate. One is the ultra-supportive monetary policy environment. As the Federal Reserve (Fed) bought trillions of dollars in bonds (so-called quantitative easing, or QE), interest rates fell to artificially low levels and stock prices climbed despite relatively flat earnings. As the Fed has started tightening its policy, the central bank–driven market has become more fundamentally driven. A more traditional business cycle where fundamentals (earnings, sales, cash flows, etc.) propel stock performance should favor active strategies going forward, a theme explored in our Outlook 2018 and Midyear Outlook 2018 publications.
Also note that companies respond differently when the economic environment gets tougher, as it may do over the next couple of years. Because of this, companies’ results and stock performance tend to disperse, creating a favorable condition for active managers.
THIRST FOR YIELD
One of the implications of QE was that market participants increasingly looked to replace bond income lost because of depressed interest rates with dividends from stock holdings. When yield became a primary determinant of which stocks did well and which ones didn’t, the fundamental research employed by many active managers became less effective. When fundamental factors such as company earnings, cash flows, and valuations drive stocks, active managers tend to do better. When macroeconomic factors such as interest rates drive stocks, active managers tend to struggle. Now that the Fed has tightened policy, and interest rates have risen, active manager performance has more opportunity to improve.
Now that the Fed has tightened policy, and interest rates have risen, active manager performance has more opportunity to improve.
In addition, rising interest rates increase and help differentiate companies’ costs of capital, which makes companies’ capital allocations more important, another characteristic of a fundamentally driven market.
CORRELATION CHALLENGE
Stocks have tended to move together in this macroeconomic environment, evidenced by elevated intra-market correlations [Figure 1]. Stock pickers struggled to differentiate themselves during this time. This statistic has seen its ups and downs in recent months; however, since the fourth quarter of 2016, correlations of S&P 500 stocks to the index have generally fallen, giving active managers more chances to differentiate themselves from the indexes they are trying to beat. Put another way, more dispersion among individual stocks makes it easier to find winners, giving managers a bigger pond of potential outperforming stocks to fish in. In late 2017, correlations between stocks reached some of the lowest levels of the past two decades and they remain well below the 10-year average on a rolling 3-month basis.

BIG GAINS TOUGH TO MATCH
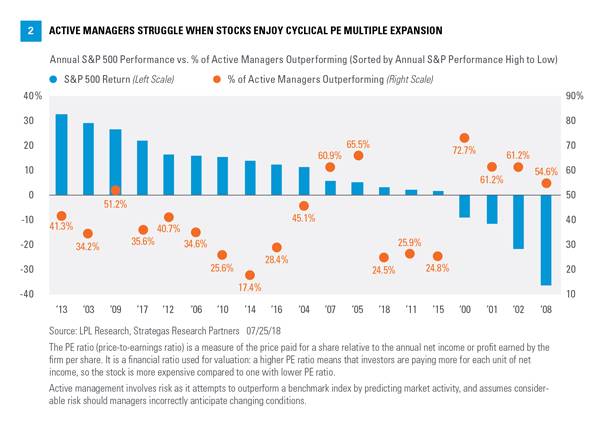
Active managers tend to struggle to outperform their equity benchmarks when stocks perform their best, i.e., when valuations are rising. Higher stock valuations were a primary goal of central banks’ stimulus efforts following the financial crisis (and delayed the return of the business cycle by reducing the market’s interest in company fundamentals). We can see this by plotting the percentage of active managers that have beaten benchmarks in a given year against annual S&P 500 returns [Figure 2]. Some of the strongest years for the stock market, which tend to come in the early to middle stages of bull markets, have been toughest for active managers, e.g., 2003, 2010–11, and 2014–15. Conversely, when stocks don’t move much (more common later in market cycles) or when they fall, active managers tend to perform better, e.g., 2000–02, 2005, and the financial crisis period (2007–09).
Some of the strongest years for the stock market, which tend to come in the early to middle stages of bull markets, have been toughest for active managers.
Does this mean we need a crisis for active managers to shine? We don’t think so. But the higher volatility that late cycle periods tend to bring may create more opportunities for active managers to beat their benchmarks. Volatility will likely be with us for a while, particularly with midterm elections coming, though we still expect low-double-digit returns for the S&P 500 in 2018, as noted in our Midyear Outlook 2018.
CONCLUSION
After a difficult past several years for active managers versus their equity benchmarks, some of the headwinds are turning to tailwinds. Central banks are starting to pull back their stimulus, which has already caused the traditional business cycle to return. Correlations are falling between individual stocks, creating more opportunities for active managers. Stock market gains may moderate. The economic environment is moving toward one where the performance of individual companies, i.e., their fundamentals, will likely determine stock price performance more than the level of interest rates or other macro factors. The comeback for active managers appears to be underway.
*****
IMPORTANT DISCLOSURES
The opinions voiced in this material are for general information only and are not intended to provide specific advice or recommendations for any individual. To determine which investment(s) may be appropriate for you, consult your financial advisor prior to investing. All performance referenced is historical and is no guarantee of future results.
The economic forecasts set forth in the presentation may not develop as predicted and there can be no guarantee that strategies promoted will be successful.
Investing in stock includes numerous specific risks including: the fluctuation of dividend, loss of principal, and potential liquidity of the investment in a falling market.
Active management involves risk as it attempts to outperform a benchmark index by predicting market activity, and assumes considerable risk should managers incorrectly anticipate changing conditions.
All indexes are unmanaged and cannot be invested into directly. Unmanaged index returns do not reflect fees, expenses, or sales charges. Index performance is not indicative of the performance of any investment.
INDEX DESCRIPTIONS
The Standard & Poor’s 500 Index is a capitalization-weighted index of 500 stocks designed to measure performance of the broad domestic economy through changes in the aggregate market value of 500 stocks representing all major industries.
Copyright © LPL Financial