
With summer approaching, the latter part of June is often a time where investors pause and reflect on the first half of the year. This year, however, we head into the end of June with markets really active, responding to a number of major developments.
President Trump continues to ramp up his trade war rhetoric with his focus shifting from Canada to China. Overseas markets have been rattled by fears of the impact of a trade war on corporate earnings but the impact in North America has been mixed.
Indices weighted in big cap multinationals like the Dow and S&P 500 have been choppy but indices with a broader exposure and more focus on smaller, domestically oriented companies have done well lately, particularly the Russell 2000 and NASDAQ Composite. The US Dollar continues to climb on a combination of relatively hawkish monetary policy at the Fed and the impact of Trump’s tough trade talk.
In terms of sectors, Entertainment and Media stocks in the US continue to attract attention. With Disney (DIS) and Comcast (CMCSA) in a bidding war for 21st Century Fox (FOXA) takeover speculation has spread to other potential targets.
Marijuana stocks in Canada have been flying high again after the Senate passed the legalization bill with legalization now expected in October.
Sterling has been sliding into Thursday’s Bank of England meeting. Governor Carney is expected to hold rates steady again. A key Brexit bill passed the House of Lords this week, but Brexit uncertainty continues to overhang the Pound.
In this week’s issue of Equity Leaders Weekly, we look at the S&P/TSX Composite Index which has shrugged off US-Canada trade uncertainty and broken out to a new all-time high. We also look at Brent Crude heading into a key OPEC meeting.
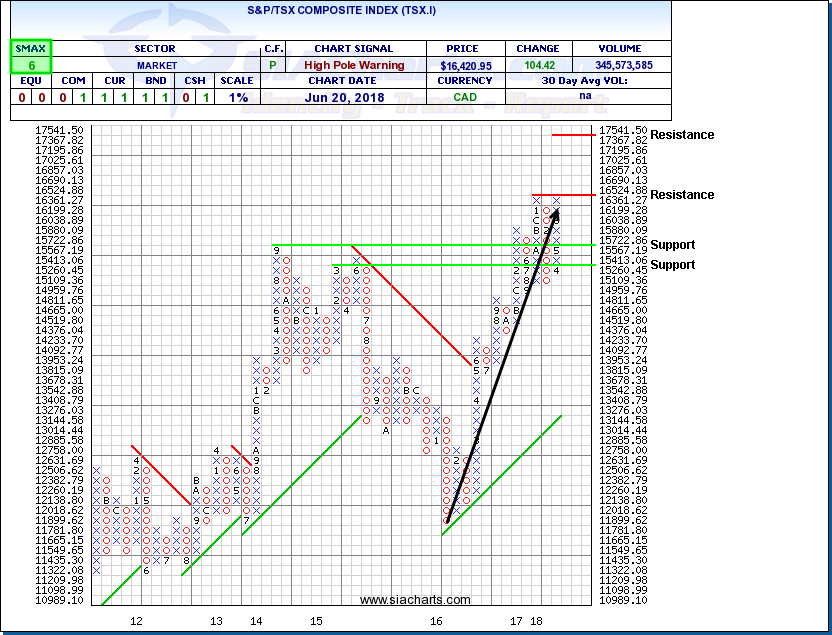
S&P/TSX Composite Index (TSX.I)
It’s often said that bull markets climb a wall of worry. This week, despite escalating fears that Canada could get caught up in a trade war brewing between the US and pretty much everyone else, the S&P/TSX broke out to a new high. While some of this could be attributed to energy and base metal stocks (which the S&P/TSX is more heavily weighted in than major US indices), and gains by the marijuana sector as full legalization approaches other factors are also playing a role.
Financials have also been gaining. With the strong US economy providing a tailwind to earnings and the headwind from potential Bank of Canada rate hikes fading, the prospects for bank earnings growth has brightened. The weakening Canadian Dollar may also be providing a boost to the prices of Canadian stocks that are also listed in the US.
Following an initial recovery rally in 2016, the S&P/TSX has been in consolidation mode for the last year or so. In recent weeks, it’s uptrend has resumed with a rally up off of 15,000 clearing 16,000 and advancing on 16,400. A break through 16,525 would confirm the start of a new upleg with next potential resistance near 17,000 then 17,500.
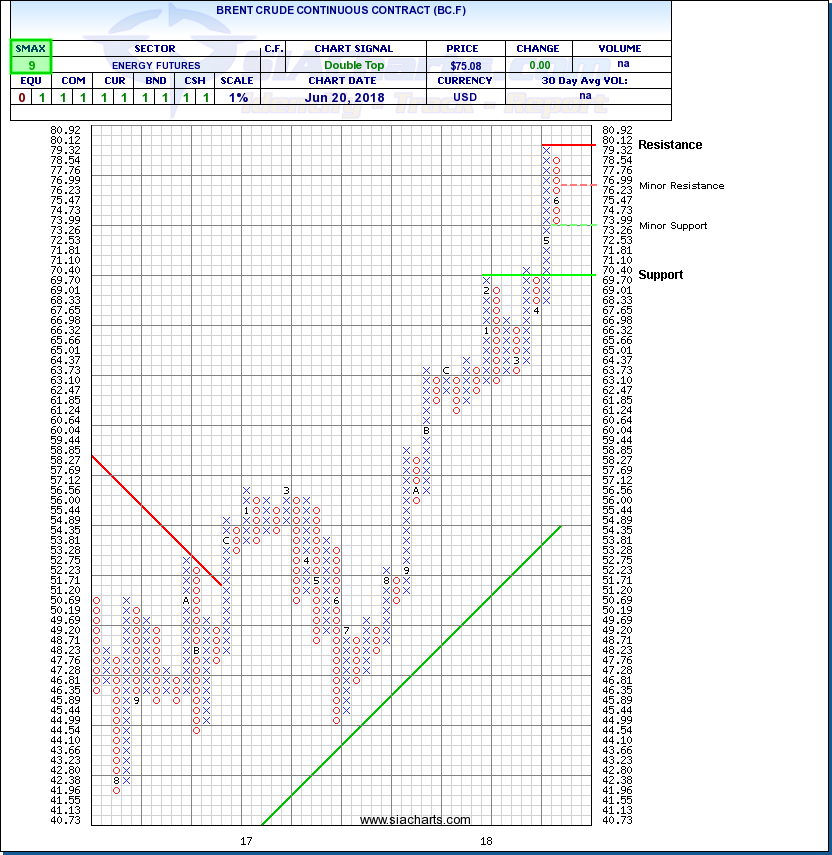
Brent Crude Continuous Contract (BC.F)
Oil prices have bounced back this week on bigger than expected drawdowns in US inventories, including a 5.9 mmbbl drawdown in the DOE report announced Wednesday. Looking forward, focus turns to the OPEC meeting and their talks with Russia about what to do about their supply management program. Investors will likely be watching two things. First do they decide to increase supply or keep the current caps. Second, if they do increase supply, how much? Is it just enough to offset the potential loss of production from Iran and Venezuela due to sanctions, or more? Whether there is a net increase, a net decrease or a reshuffling of quotas could have a significant impact on the trend in oil prices in the coming months.
Following a run up from around the $60.00 per barrel area earlier this year, Brent Crude appears to have settled into the $70.00 to $80.00 range heading into the meeting. Initial resistance may appear near $67.00 with initial support near $73.25.
SIACharts.com specifically represents that it does not give investment advice or advocate the purchase or sale of any security or investment. None of the information contained in this website or document constitutes an offer to sell or the solicitation of an offer to buy any security or other investment or an offer to provide investment services of any kind. Neither SIACharts.com (FundCharts Inc.) nor its third party content providers shall be liable for any errors, inaccuracies or delays in content, or for any actions taken in reliance thereon.