by Frank Holmes, CIO, CEO, U.S. Global Investors
Share this page with your friends:
Please note: The Frank Talk articles listed below contain historical material. The data provided was current at the time of publication. For current information regarding any of the funds mentioned in these presentations, please visit the appropriate fund performance page.
June 12, 2018
Gold is one of the rarest elements in the world, making up roughly 0.003 parts per million of the earth’s crust. But how much gold is the world digging up each year and what countries produce the most?
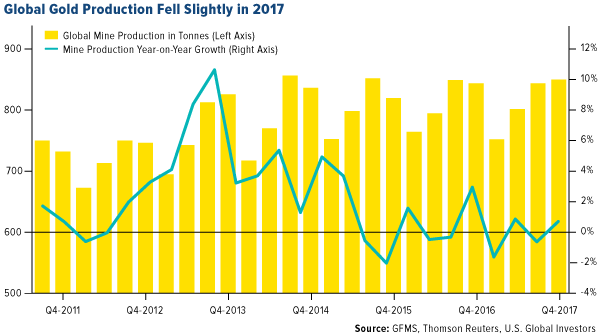
In 2017, global gold mine production was a reported 3,247 tonnes. This figure is down 5 tonnes from the previous year and marks the first annual drop since 2008, according to the GFMS Gold Survey 2018. The driving forces behind the drop in output were environmental concerns, crackdowns on illegal mining operations and rising costs.
This raises the question I’ve explored recently – have we reached peak gold? The idea is that all the easy gold has already been discovered and explorers have to dig deeper to find economically viable deposits. For example, South Africa was once the top gold-producing country by far, digging up over 1,000 tonnes in 1970, but annual output has fallen steadily since. On the other hand, several nations have emerged in the last few years as growing gold producers. China and Russia have both seen production in an overall upward trend.
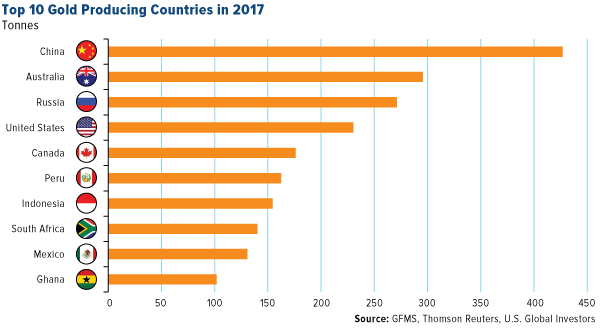
As seen in the chart below, China takes the number one spot of global gold producers by a wide margin, extracting 131 tonnes more than second place Australia. The top 10 rankings remained unchanged from 2016 to 2017, with the exception of Canada and Indonesia switching between fifth and seventh place, respectively. Of the top producers, Russia posted the largest annual gain, boosting output by 17 tonnes.
Below are more details on the top 10 countries with the largest gold production in 2017, beginning with the top producer and top consumer of bullion, China.
1. China – 426 tonnes
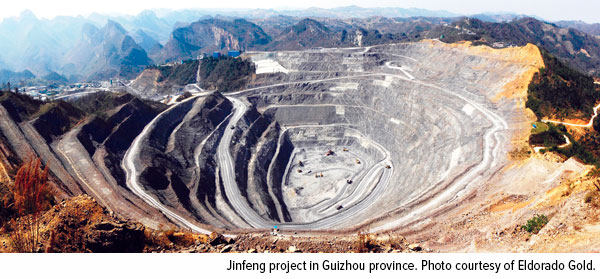
For many years China has been the top producing nation, accounting for 13 percent of global mine production. Production fell by 6 percent last year due to escalated efforts by the government to fight pollution and raise environmental awareness. However, production is expected to pick back up this year due to several mine upgrades at existing projects.
2. Australia – 295.1 tonnes
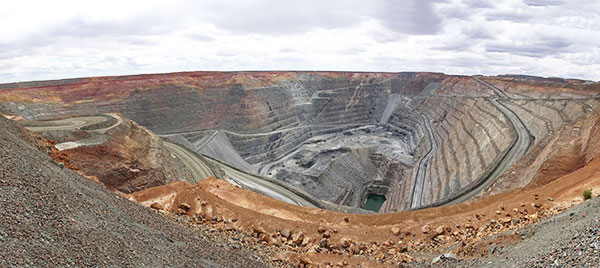
Although gold production increased 5 tonnes from the previous year in Australia, MinEx Consulting released a report detailing an expected drop between 2017 and 2057 unless the amount spent on exploration is doubled. The minerals industry produces over half of Australia’s total exports and generates about 8 percent of GDP.
3. Russia – 270.7 tonnes
A massive 83 percent of European gold comes from Russia, which has been increasing its production every year since 2010. The nation increased output by 17 tonnes last year, even as the ruble appreciated 13 percent, which hurts producers with weaker revenue growth relative to the cost of production. Who is the largest buyer of Russian gold? The Russian government, of course, which purchases around two-thirds of all gold produced locally.
4. United States – 230.0 tonnes
Gold output rose by 8 tonnes in the U.S. last year, marking the fourth consecutive year of annual increases. Production was supported by project ramp-ups at the Long Canyon project in Nevada and the Haile project in South Carolina. Around 78 percent of American gold comes from Nevada alone.
5. Canada – 175.8 tonnes
 |
Canada inched up two spots on the list in 2017, producing 10 more tonnes of gold than the previous year. Toronto-based Seabridge Gold stumbled upon a significant goldfield in northern British Colombia after a glacier retreated and is estimated to contain a whopping 780 metrics tonnes. This could be a source of increased output in the coming years.
6. Peru – 162.3 tonnes
Gold output fell for the second consecutive year in Peru, by 6 tonnes, largely due to crackdowns on illegal mining operations in the La Pampa region. Mining is a significant portion of Peru’s economy and the nation is also number three in the world for copper production.
7. Indonesia – 154.3 tonnes
Production in the archipelago nation fell by 11.7 percent, dropping to number seven on the list of top global producers. The Indonesian government introduced a tax amnesty program that hoped to repatriate money from overseas, which led to production falling at new main sites as traders were reluctant to remain in the mining industry.
8. South Africa – 139.9 tonnes
Once the top gold-producer in the world by a wide margin, South Africa’s gold mines have been slowing every year since 2008, with the exception of 2013 when production rose by a few tonnes. The nation is still home to the world’s deepest gold mine, the Mponeng mine, extending 2.5 miles underground.
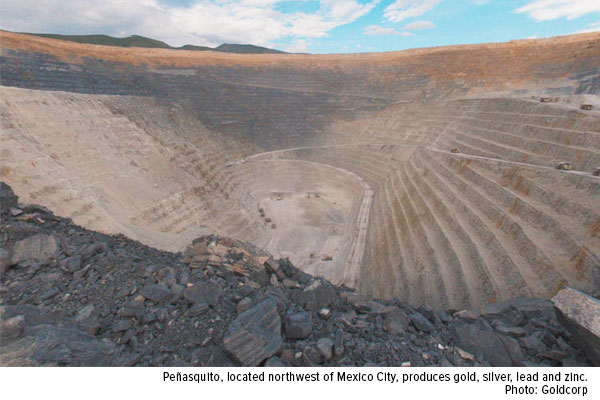
9. Mexico – 130.5 tonnes
Although production fell three tonnes from 2016 to 2017, Mexico remains a competitive gold source. Output has risen from just 50.8 tonnes in 2008 to over 130 tonnes last year, one of the largest increases in a nine year span. Mexico is an attractive place for mining due to a relatively low cost of regulation.
10. Ghana – 101.7 tonnes
Ghana is Africa’s second largest producer of gold and is also known for its reserves of various industrial minerals. Bullion production rose 7 tonnes over the previous year and accounts for over 20 percent of the nation’s total exports.
All opinions expressed and data provided are subject to change without notice. Some of these opinions may not be appropriate to every investor. By clicking the link(s) above, you will be directed to a third-party website(s). U.S. Global Investors does not endorse all information supplied by this/these website(s) and is not responsible for its/their content.
Holdings may change daily. Holdings are reported as of the most recent quarter-end. The following securities mentioned in the article were held by one or more accounts managed by U.S. Global Investors as of 03/31/2018: Seabridge Gold Inc., Goldcorp.
Gross domestic product (GDP) is the monetary value of all the finished goods and services produced within a country's borders in a specific time period, though GDP is usually calculated on an annual basis. It includes all of private and public consumption, government outlays, investments and exports less imports that occur within a defined territory.
This post was originally published at Frank Talk.
Copyright © U.S. Global Investors


