by John Lynch, Chief Investment Strategist and Ryan Detrick, Senior Market Strategist, LPL Financial
KEY TAKEAWAYS
- After a great start to 2018, we believe small caps’ strength to continue.
- Technicals remain strong, whereas tax reform and trade worries are also tailwinds for small caps.
- A higher trending U.S. dollar may also support small cap performance given their domestic focus.
Small caps are having a strong year, with the Russell 2000 Index up nearly 6% year to date, versus about 2% for the S&P 500 Index. We came into this year expecting small cap outperformance, and after a slow start in early 2018 they have delivered in recent months. Many factors have aligned to drive continued potential leadership from this group. Here we highlight three keys to our small cap outlook.
THREE KEYS TO SMALL CAP OUTLOOK
1. TECHNICALS
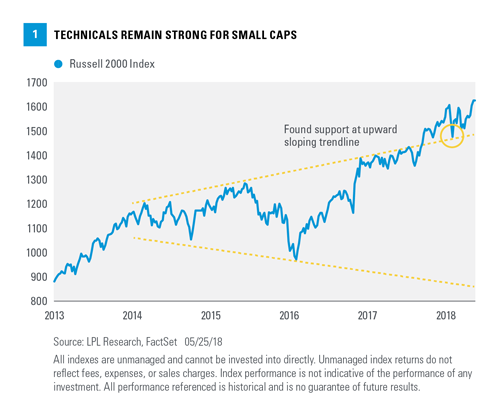
Small caps continue to look very strong from a technical point of view. The Russell 2000 Index bottomed for the calendar year on February 8, 2018, and it has gained more than 11% since then, nearly doubling the return on the S&P 500 over this period. As Figure 1 shows, the February lows took place right at support on an upward sloping trend line. This successful retest of a previous resistance line is exactly what we wanted to see, and the subsequent acceleration higher bodes well for continued strength from small caps.
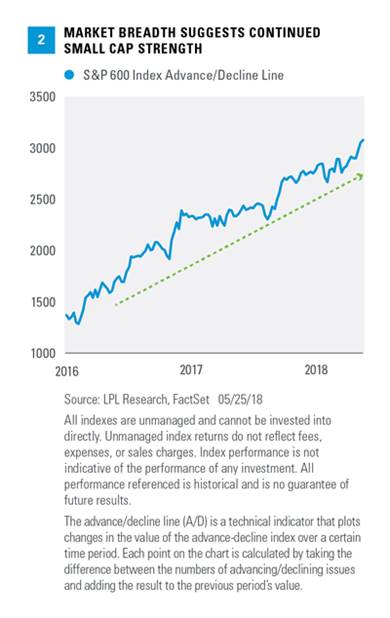
 Another important clue that the small cap strength may be here to stay is market breadth. One of our favorite measures of market breadth is the advance/decline (A/D) line, a cumulative measure of how many stocks are participating in a market move. From a technical perspective, it is important for sustainable market index moves higher to be confirmed by rising A/D lines. Fortunately, the S&P 600 Small Cap A/D line recently made yet another new all-time high, further confirming small cap strength and increasing the potential for continued new highs [Figure 2].
From a contrarian point of view, small caps also offer an opportunity for suitable investors. According to recent Morningstar data, small cap equity funds have seen outflows for 14 consecutive months. This suggests there could be ample room for flows that could push small caps solidly higher as sentiment improves.
Small caps could also be signaling that large caps could eventually make new highs. Earlier in May, the Russell 2000 made a new all-time high, yet the S&P 500 was still more than 5% away from its own new high. The last time this happened was January 2013, and a nice time for equities soon ensued, with small caps leading the way higher. We think small caps’ leadership could suggest future strength and potential new highs for large caps.
2. TAXES AND TARIFFS
As we discussed in Outlook 2018: Return of the Business Cycle, small caps were one of our favorite areas for equity strength this year. A potentially higher U.S. dollar, cyclicals leading, and, most importantly, corporate tax reform were all reasons we liked the group.
We expected cyclicals to do well this year, as the economy continued to surprise to the upside, another trend we think may continue. Historically, small caps do better than large caps when cyclicals (technology, financials, industrials) do well. Moreover, the tax rate for small caps is an estimated 5% higher on average than for large caps. The tax reform passed in late 2017 is expected to continue to be a major tailwind for the group.
Here’s the catch, though: Small caps lagged large caps last year and again—by a wide margin—earlier this year. That all changed once risk of a potential trade war with China began to heat up. While risks have lurked at the edges, they started to come into focus following President Trump’s announcement of a 25% tariff on steel imports on March 1, 2018. The Russell 2000 has added nearly 8% since then, versus less than a 2% gain for the S&P 500. Why have small caps done so well with the threat of a trade war? For starters, small caps get about 20% of their revenue from overseas, compared to roughly 40% for S&P 500 companies.
3. U.S. DOLLAR
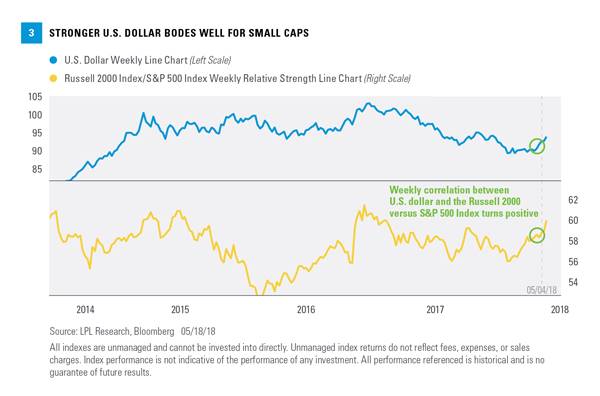
We believe the US Dollar should strengthen further (Weekly Economic Commentary) despite the recent bounce, partly because of rising interest rates, weak economic data overseas, and a repatriation of overseas cash. As Figure 3 shows, when the U.S. dollar strengthens, small caps tend to outperform large caps. With room for the U.S. dollar to move higher in the short term, we think this is another tailwind for small caps to potentially outperform large caps.
CONCLUSION
We continue to favor small caps over their large cap counterparts, primarily because of tax reform, trade policy, and a potentially stronger U.S. dollar. Importantly, we are not suggesting having a larger percentage of small caps than large caps in portfolios, as small cap stocks have historically been more volatile. However, for appropriate investors, we do suggest overweighting small cap allocations relative to respective benchmarks as we look out over the rest of 2018.
Thanks to Dave Tonaszuck, CMT, for his contribution this week.
*****
IMPORTANT DISCLOSURES
The opinions voiced in this material are for general information only and are not intended to provide specific advice or recommendations for any individual. To determine which investment(s) may be appropriate for you, consult your financial advisor prior to investing. All performance referenced is historical and is no guarantee of future results.
The economic forecasts set forth in the presentation may not develop as predicted and there can be no guarantee that strategies promoted will be successful.
Investing in stock includes numerous specific risks including the fluctuation of dividend, loss of principal, and potential liquidity of the investment in a falling market.
The prices of small cap stocks are generally more volatile than those of large cap stocks.
Currency risk is a form of risk that arises from the change in price of one currency against another. Whenever investors or companies have assets or business operations across national borders, they face currency risk if their positions are not hedged.
All investing involves risk including loss of principal.
Technical analysis is a methodology for evaluating securities based on statistics generated by market activity, such as past prices, volume, and momentum, and is not intended to be used as the sole mechanism for trading decisions. Technical analysts do not attempt to measure a security’s intrinsic value, but instead use charts and other tools to identify patterns and trends. Technical analysis carries inherent risk, chief among which is that past performance is not indicative of future results. Technical analysis should be used in conjunction with fundamental analysis within the decision-making process and shall include but not be limited to the following considerations: investment thesis, suitability, expected time horizon, and operational factors, such as trading costs.
Investing in mutual funds involves risk, including possible loss of principal. The funds value will fluctuate with market conditions and may not achieve its investment objective. Upon redemption, the value of fund shares may be worth more or less than their original cost.
INDEX DESCRIPTIONS
The Standard & Poor’s 500 Index is a capitalization-weighted index of 500 stocks designed to measure performance of the broad domestic economy through changes in the aggregate market value of 500 stocks representing all major industries.
The S&P Small Cap 600 covers approximately 3% of the domestic equities market. Measuring the small cap segment of the market that is typically renowned for poor trading liquidity and financial instability, the index is designed to be an efficient portfolio of companies that meet specific inclusion criteria to ensure that they are investable and financially viable.
The U.S. Dollar Index measures the performance of the U.S. dollar against a basket of foreign currencies: EUR, JPY, GBP, CAD, CHF, and SEK. The U.S. Dollar Index goes up when the dollar gains “strength” compared to other currencies.
The Russell 2000 Index measures the performance of the small cap segment of the U.S. equity universe. The Russell 2000 Index is a subset of the Russell 3000 Index, representing approximately 10% of the total market capitalization of that index.
Copyright © LPL Financial


