How to play the oil price rally

by Richard Turnill, Global Chief Investment Strategist, Blackrock

The price of oil has surged in 2018. Richard explains our take on how to play the rally.

A rise in Persian Gulf-related geopolitical risks has helped fuel double-digit gains in oil this year. A favorable supply-demand picture has provided additional juice, making oil a top-performing asset class in 2018. For investors seeking exposure to oil now, we see more appeal in energy equities than in the commodity.

This year’s spike in the oil price coincides with rising concerns about Persian Gulf tensions. This is reflected in a proprietary BlackRock indicator that scrapes the text of broker reports and financial news articles to assess the market’s attention to the risk. See the orange line in the chart below.

106459_BII_COTW_050718_v6_web_26blog

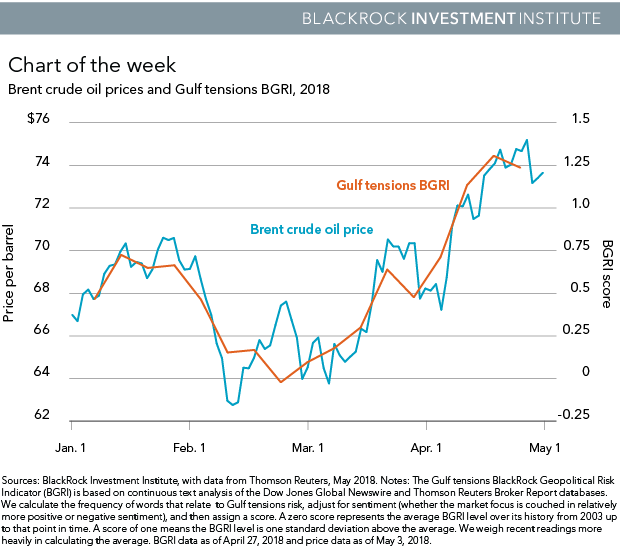
Investors today appear to be pricing in potential for supply disruptions if the U.S. does not extend its waivers on Iran oil sanctions–and worries over proxy wars in the Gulf region. This geopolitical risk premium comes amid OPEC production cuts and firming global demand for oil thanks to the global expansion. It also may explain why recent higher oil prices have not been associated with strong performance in other risk assets, a break from the past two years.

A stronger case for energy equities.

We see today’s backdrop of heightened Gulf tensions, supply constraints and steady global economic growth persisting. Geopolitical tensions in the Middle East could flare further in the near term, particularly between the U.S. and Iran (see the Week ahead). Oil supply could also tighten if OPEC extends production cuts in June, or Venezuelan production falls further. Yet the rise in oil prices we have seen so far is unlikely to pose a significant drag on the global economy and its impact on core inflation should be minimal, we believe.

Read more market insights in my Weekly Commentary.

For investors seeking exposure to oil today, we see a stronger case for investing in energy equities over crude itself or energy-related debt. Oil prices have run well ahead of energy stocks this year but this trend has started to turn. One factor supporting energy firms: their focus on capital discipline, evident in first-quarter earnings results. Unlike in some past oil market rallies, companies are not making huge investments in future production. Instead, they are using free cash flow to return capital to shareholders via increased buybacks and dividends.

Risks to our view.

A hefty drop in oil prices, possibly sparked by a large U.S. shale production boost or falling demand. Oil futures have lagged the rise in spot prices, indicating the supply/demand balance may be more challenged in 2019. Further U.S. dollar gains could also weigh on oil–with a knock-on to related assets–if the historical negative correlation between the dollar and oil prices reasserts itself after a recent breakdown.

The good news.

Current oil prices offer potential upside for energy companies’ earnings and stock prices. Most energy companies have budgeted for mid-$50s oil prices in 2018, with this conservative outlook reflected in share prices today. This points to valuation upside should current levels of oil prices be sustained. In energy equities, we like exploration and production firms and midstream companies. We also see some opportunities in emerging market (EM) energy stocks.

Richard Turnill is BlackRock’s global chief investment strategist. He is a regular contributor to The Blog.


Copyright Š Blackrock

Total
0
Shares
Previous Article

VALEANT PHARMA INTL (VRX.TO) TSX - May 09, 2018

Next Article

Earnings vs. Rates—The Market Tug of War

Related Posts
Read More

Falling short: Why are long-dated bonds struggling in 2025?

Rate cuts in the developed world kicked off meaningfully in June 2024 with the Bank of Canada, then the European Central Bank (ECB). The Bank of England followed in August 2024 and the US Federal Reserve played catch up in September 2024 with a 50 basis points (bp) first cut. There have been cumulative ‘soft-landing’ rate cuts of between 100bp and 225bp across the developed world, yet over this same time period we have witnessed a sustained rise in long-dated bond yields.1 This has culminated in current post-Covid yield highs for 30-year bonds in a number of countries, with some markets such as the UK trading at levels not seen for over 25 years. Recall that bond prices fall when yields rise and vice versa, so recent movements in longer-dated bond yields have led to underperformance (and in most cases negative returns) from this area of the bond market. Movements have varied across bond maturities and countries, so careful selection has been crucial. Country and curve positioning matters Yield change (year to date) for government bonds of different maturities A column chart showing the year to date change in yield for 2 year, 5 year, 10 year and 30 year government bonds. The vertical axis shows the change in yield ranging from -0.75% to +0.75%. The horizontal axis has different countries, US, UK, Germany, Australia and Japan. For every country the 30 year bond yield has risen, with Germany and Japan the most extreme at more than 0.7%. In contrast , 2 year bonds have seen a fall in yields except Japan. Source: Bloomberg, 2-year, 5-year, 10-year and 30-year government bonds for selected countries, change in yield (percentage point change year to date), 31 December 2024 to 15 August 2025. Y = year. Past performance does not predict future returns. At times in 2025 we have witnessed bouts of rising yields which have felt crisis-like: the UK in early January 2025, and Japan’s long end in May 2025. However, for the most part, the rise in long-end bond yields has been persistent but less headline-grabbing. In August, we have seen new highs for this cycle in 30-year Gilts and 30-year European bonds. The US bond market has outperformed on rising expectations of rate cuts and 30-year yields still hover just 20bp below the highs from October 2023.2 There remain medium term concerns about inflation and fiscal deficits that continue to bubble up in different countries at different times: for example, in August 2024 it was the persistence of UK inflation, in March 2025 German fiscal expansion. Importantly however, there does appear to be what might be described as a “market structure” issue: a structural slowdown in duration demand (i.e. demand for longer-dated bonds) which is causing sustained and continued pressure on long-dated bond yields in a number of geographies. There remains a sobering fragility to this part of global bond markets which is noteworthy. So what is going on? As central banks cut interest rates in an easing cycle, some steepening of the yield curve is to be expected. However, beyond this cyclical driver, there are three factors that appear to account for the rise in long-end yields: Buyers strike: The traditional buyers of 30 year plus bonds come from the institutional investment community. In different countries there has been reduced demand from these investors for their own particular domestic reasons: in the UK the collapse of duration demand from the defined benefit pension funds post 2022; in Europe it is pension fund reform in the Netherlands which has been a focal point; and in Japan a structural reduction in demand from the life insurance sector (reduced inflows to life insurers versus banks and life insurance sales shifting away from super-long liability products). Quantitative Tightening: At the same time as cutting rates, central banks have continued to shrink their holdings of government bonds. Except for the UK, where active selling of bonds has been part of the policy mix since November 2022 and has included selling longer dated bonds back to the market, quantitative tightening has been in ‘passive’ form i.e. letting existing holdings mature and not be reinvested. The Bank of England are widely expected to announce a reduction in the pace of the active selling in September 2025: the debate is by how much. Fiscal deficit concerns: There is no end in sight to the growth of deficits. The German election in February saw a dramatic increase in debt-fuelled infrastructure and military spending announced, whilst Japan and Canada await post-election fiscal plans which are likely to see increased spending. The UK and France continue to struggle to exhibit credible fiscal discipline whilst the recent US “One Big Beautiful Bill Act” was somewhat fiscally expansionary (albeit less so after the effects of tariff income). We are now in an environment across the developed world of non-synchronised interest rate cycles, which is being reflected in the increasingly divergent performance of bond markets across different countries in the developed world. Selecting the right geography to have duration and the right part of the yield curve is of paramount importance. 1Source: LSEG Datastream, reference is to cumulative rate cuts among US Federal Reserve, European Central Bank, Bank of Canada and Bank of England, 31 May 2024 to 31 July 2025. 2Source: Bloomberg, US 30-year government bond yield,19 October 2023 to 19 August 2025. Yields may vary over time and are not guaranteed. Fixed income securities are subject to interest rate, inflation, credit and default risk. The bond market is volatile. As interest rates rise, bond prices usually fall, and vice versa. The return of principal is not guaranteed, and prices may decline if an issuer fails to make timely payments or its credit strength weakens.Jenna Barnard, Head of Global Bonds, explores why longer-dated government bonds have struggled during 2025 despite central bank rate cuts.
Subscribe to AdvisorAnalyst.com notifications
Watch. Listen. Read. Raise your average.