David was the King of Israel and the writer of many of the Psalms. He spent his formative years as a shepherd and framed his life’s work around the key concepts from his profession. Herds were the primary form of wealth back then, while common stocks are a primary form today. We feel we serve as a shepherd of our concentrated stock portfolio and of our end clients/shareholders. As we get ready for the next phase in the US stock market, we thought it would be helpful to compare what we do with what David did as a good shepherd.
1. We shall not be in want.
As both an investor and a shepherd of investors, we must remain content when other stock picking disciplines have extended momentum. We are often asked during the vetting process with new investors when our underperformance periods will occur. Our answer never changes. First, we have historically underperformed when weak balance sheet, labor-intensive and capital-intensive businesses are popular. China’s economic popularity during the 2004-2011 period, when their gross domestic product (GDP) growth rate seemed to be stuck at 10%, is one example. The chart below shows how superior energy, basic materials and heavy industrial stocks were to the market average.
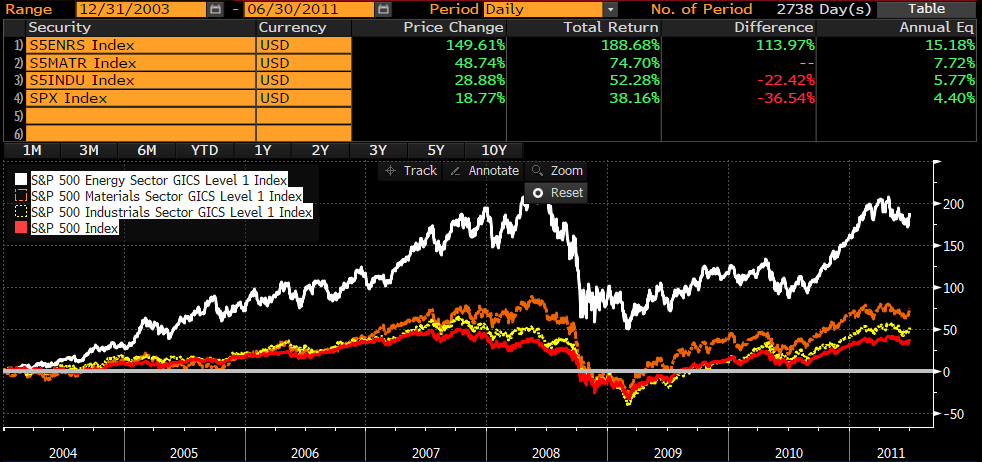
Bloomberg. Data for the time period 12/31/2003 – 6/30/2011. Past performance does not indicate future results. Cannot invest directly in an index.
The second type of market we underperform is a market dominated by fast growing, high price-to-earnings ratio companies driven by momentum. The tech bubble of 1998-2000 sucked all the oxygen out of the stock market and left no capital for any securities other than tech and telecom companies. The current market, dominated by glamour tech stocks, has existed off and on for the last three years and lately has sucked all the oxygen out of the rest of the market. We are likely to trail the US stock market at the height of these euphoria episodes and remain very content with our long-duration portfolio discipline, which is based on our eight criteria for stock selection.
Look at the chart below. 60% of the money made in the S&P 500 during the last four-plus years came from only seven common stocks.
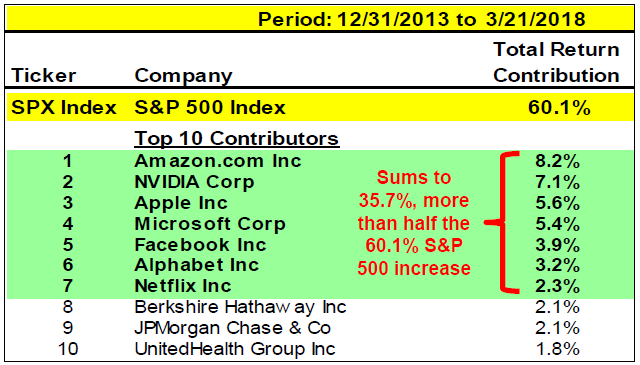
Source: Stifel Market Strategy report, June 1, 2017. Data for the time period 1/1/2015 – 5/30/2017.
You might think we violate this premise by holding our winners to a fault. In our discipline, we seek out companies that fit our eight criteria and love it when it is a company which investors dislike despite their long-term success. eBay has been one of those companies for us. No matter how well eBay and their spin-off, PayPal, have done, eBay never seems to gain favor in the stock market.
2. Attempt to go to green investment pastures.
In his book A Shepherd Looks at Psalm 23, W. Phillip Keller said, “Sheep are notorious creatures of habit. If left to themselves, they will follow the same trails until they become ruts; graze the same hills until they turn to desert wastes; pollute their own ground until it is corrupt with disease and parasites.”
History shows that low price-to-earnings (P/E) and high free cash flow companies outperform over five and ten-year stretches. History also shows that investors substantially underperform the long-term results of their underlying investments. Investors act like sheep by continuing to walk through the same ruts to feed at the same trough. Then they flee the area when the next bear market shows up because they are incapable of holding for the long haul. Warren Buffett likes to say, “What the wise man does in the beginning, the fool does in the end.”

Source: Dalbar Study. Data as of 12/31/2016. Past performance is no guarantee of future results.
The Dalbar research shows that over the longest stretches of time, passive fund low-cost was burned up in poor investor choices. In the recent three years, it shows how completely dominant the index has been in comparison to active manager results. If the past is any guide, our pasture appears very green and lush. We believe that the large gap between the P/E and price-to-free cash flow of our portfolio relative to the S&P 500 Index and the Russell 1000 Value Index bodes extremely well for our portfolio over the next five to ten years. Back in 2011-2012, we were very excited about our portfolio trading at 12x P/E estimates, while the S&P 500 was trading around 14x. In retrospect, our excitement was validated by five consecutive years of outperformance.
3. Seek to find still waters.
Historically expensive markets demand extra discipline and a greater margin of safety. We must own a portfolio which we’d be proud to own in a temporary decline of 30% or more. Chasing performance in a momentum environment has been a really good way to eradicate wealth. Shelby Cullom Davis, a great investor in his own right, pointed out that the investments which made everyone rich in the previous twenty years are likely to make them poor in the following ten years. This is the best run that large-cap growth has had in relation to large-cap value in my lifetime.
4. Seek to restore our faith in history.
This is the longest period of growth stock outperformance of the last 80 years. See the chart below:
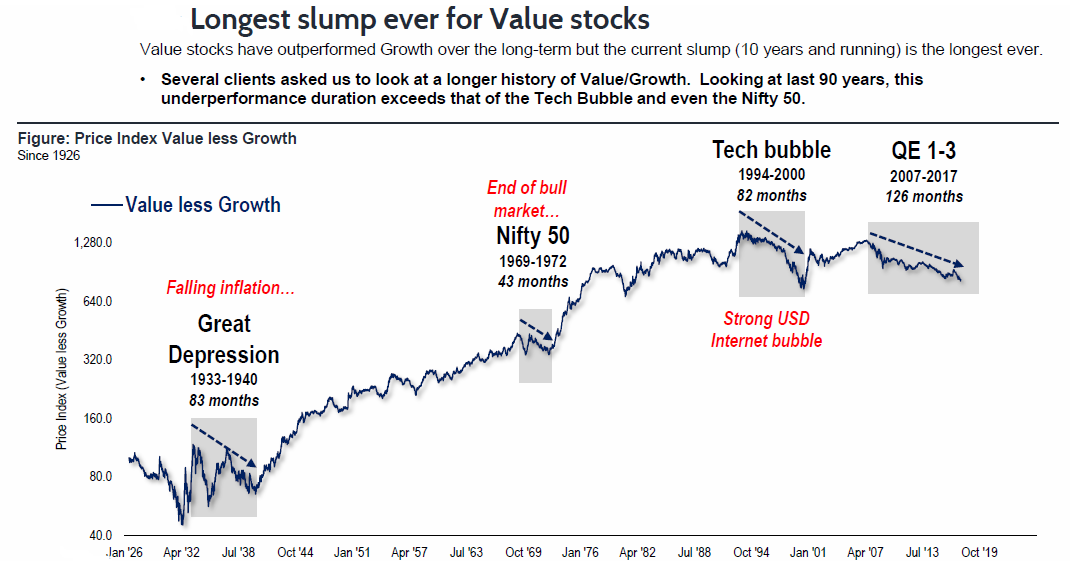
Source: Fundstrat “Value continues to gain traction, Value Cyclicals leading turn” published September 22, 2017.
History reminds us that corrections in glamorous momentum stocks can be extremely vicious. Notice the price declines of RCA, AOL-Time Warner and numerous highly thought of Nifty-Fifty stocks.2 What makes today’s investors in Amazon (AMZN), Netflix (NFLX) and Tesla (TSLA) think that they won’t get a similar comeuppance? There are no guarantees in the investing business other than that things will change.
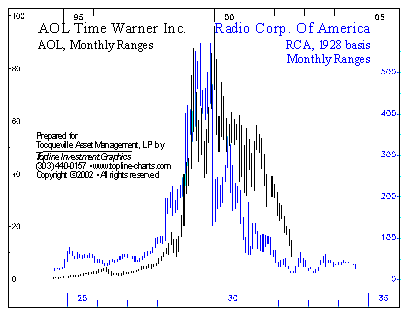
Source: csinvesting (http://csinvesting.org/2014/01/32 08/the-need-to-diversify/).
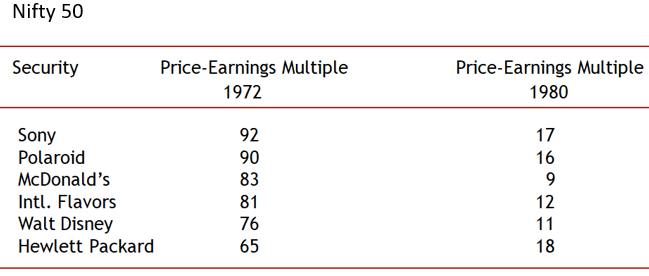
Source: Burton Gordon Malkiel, “A Random Walk Down Wall Street.”
5. Follow the right paths.
We must be religious about sticking to our discipline. Varying from your discipline to make temporary rewards is an unforgivable sin in stock picking. Robert Rodriguez, retired Partner and Chief Executive Officer at FPA, wrote in his Letter to Shareholders in May of 2009, “I believe superior long-term performance is a function of a manager’s willingness to accept periods of short-term underperformance. This requires the fortitude and willingness to allow one’s business to shrink while deploying an unpopular strategy.”
6. We fear no evil.
Bear markets refresh our portfolio by giving us the opportunity to buy wonderful companies meeting our eight criteria at bargain basement prices. In many industries being attacked by FAANG stocks, a bear market has existed for months already. Walgreens, Target, Kroger, Discovery Communications and other names we own have fallen more than 20% and we relish buying more at depressed prices. Missing out on late stage, glam stock momentum success is our job.
7. Market declines could prepare a table for us.
In our opinion, the best bargains are being created by momentum stocks sucking up all the cash and becoming outsized positions in popular indexes and exchange traded funds (ETFs).
Below are quotes from an article published on March 28, 2018 in The Wall Street Journal titled “Warning Sign: Tech Stocks Are Dominating Global Markets Like Never Before”:
“Investors’ concern is that these companies have in recent years grown so much and so fast that they now have outsize[d] influence on broader stock indexes, such as the S&P 500 and the Nasdaq Composite. Their rapid gains have come alongside heavy inflows into passive funds that track these indexes, leaving millions of investors susceptible to greater downside should tech stocks struggle more.”
Investors are going to realize the index is a glorified large-cap growth fund in an environment where growth is way overpriced.
“Facebook, Amazon, Netflix Inc. and Alphabet together account for a 7.8% weighting in the S&P 500, more than double from five years ago. The overall tech sector now has a 26.8% weight in the S&P 500, making it by far the largest component. Financial stocks, in second place, account for 16.8%, according to Thomson Reuters.”
8. Our cup could overflow.
In our opinion, low P/E, low price-to-free cash flow, and high dividend strategies may be about to take command of this stock market. History and mean reversion can be defied for a while, but we believe it is not “different this time.” The last episode like this was in 2000-2003. Technology lost favor and most other sectors of the market either held their own or rose.
9. How do you find good long-term results?
Since the S&P 500 Index and growth stock indexes have been dominating in recent years, the academic evidence suggested by the research of Martin Cremers and his associates is useful. He appears to prove that high conviction portfolios outperform low conviction ones and that the only statistically effective investment method is combining it with low turnover. His academic research verifies Charlie Munger and others who argued their stock picking success comes from knowing a small number of securities well and being very patient owning them. He calls it “ignorance reduction.”
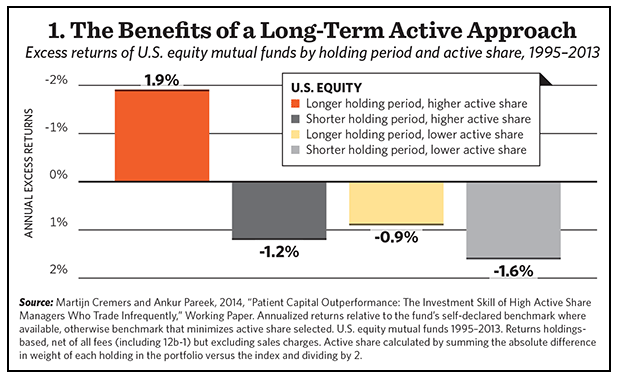
Source: Think Advisor (http://www.thinkadvisor.com/2015/08/31/why-and-when-activemanagersshine-and-how-to-spot). Data for the time period 1/1/1995 – 12/31/2013.
We are more convinced than ever that a well-chosen and concentrated portfolio, which is minded and refreshed with light turnover and attention, will continue to fulfill what Martin Cremers and his various associates have proven. Thank you for your ongoing confidence and trust in our portfolio management discipline.
1Nifty Fifty refers to the 50 popular large-cap stocks on the New York Stock Exchange in the 1960s and 1970s that were widely regarded as solid buy and hold growth stocks.
2FAANG stocks: Facebook, Apple, Amazon, Netflix and Google parent Alphabet.
Alpha is a measure of performance on a risk-adjusted basis. A basis point is one hundredth of one percent. Earnings-per-share (EPS) is the portion of a company’s profit allocated to each outstanding share of common stock. Earnings per share serves as an indicator of a company’s profitability. The price-earnings ratio (P/E Ratio) measures a company’s current share price relative to its per-share earnings. The price-to-book ratio (P/B Ratio) is a ratio used to compare a stock’s market value to its book value. It is calculated by dividing the current closing price of the stock by the latest quarter’s book value per share. The price-to-free cash flow ratio (P/FCF) is a valuation method used to compare a company’s current share price to its per-share free cash flow. Margin of safety (safety margin) is the difference between the intrinsic value of a stock and its market price.
The information contained herein represents the opinion of Smead Capital Management and is not intended to be a forecast of future events, a guarantee of future results, nor investment advice.
Smead Capital Management, Inc.(“SCM”) is an SEC registered investment adviser with its principal place of business in the State of Washington. SCM and its representatives are in compliance with the current registration and notice filing requirements imposed upon registered investment advisers by those states in which SCM maintains clients. SCM may only transact business in those states in which it is notice filed or qualifies for an exemption or exclusion from notice filing requirements. Registered investment adviser does not imply a certain level of skill or training.
This newsletter contains general information that is not suitable for everyone. Any information contained in this newsletter represents SCM’s opinions, and should not be construed as personalized or individualized investment advice. Past performance is no guarantee of future results. There is no guarantee that the views and opinions expressed in this newsletter will come to pass. Investing in the stock market involves gains and losses and may not be suitable for all investors. Information presented herein is subject to change without notice and should not be considered as a solicitation to buy or sell any security. SCM cannot assess, verify or guarantee the suitability of any particular investment to any particular situation and the reader of this newsletter bears complete responsibility for its own investment research and should seek the advice of a qualified investment professional that provides individualized advice prior to making any investment decisions. All opinions expressed and information and data provided therein are subject to change without notice. SCM, its officers, directors, employees and/or affiliates, may have positions in, and may, from time-to-time make purchases or sales of the securities discussed or mentioned in the publications.
This Newsletter and others are available at smeadcap.com
Copyright © Smead Capital Management


