Political and economic uncertainty continues to drive market swings in both directions. It seems that just as one issue fades, another pops up to take its place. The economic uncertainty surrounding a possible trade war between the US and China, for example, has given way to political uncertainty over rising tensions in the Middle East, particularly related to Syria. Meanwhile, the Fed is still planning to continue raising interest rates, NAFTA talks continue and earnings season is about to start.
So far confession season (just after quarter end when companies tend to put out profit warnings) has been quiet suggesting that in general, management teams are expecting to at least achieve their targets. Guidance may be just as important as the results, particularly for financials and utilities dealing with rising interest rates and energy companies which may benefit from higher pricing. The threat of consumer revolt or increased privacy regulation on technology stocks is something that may play out over the longer term and as such, may not show up in the numbers yet for impacted big tech names.
One potential saving grace for stocks may be that since indices have come down in recent weeks, expectations may not be quite as high, leaving the door open to positive surprises.
In this week's issue of the Equity Leaders Weekly we look at the impact of easing global trade tensions and increasing political tensions on the crude oil price. With US bank earnings starting on Friday, we also take a look at the S&P Bank Index.
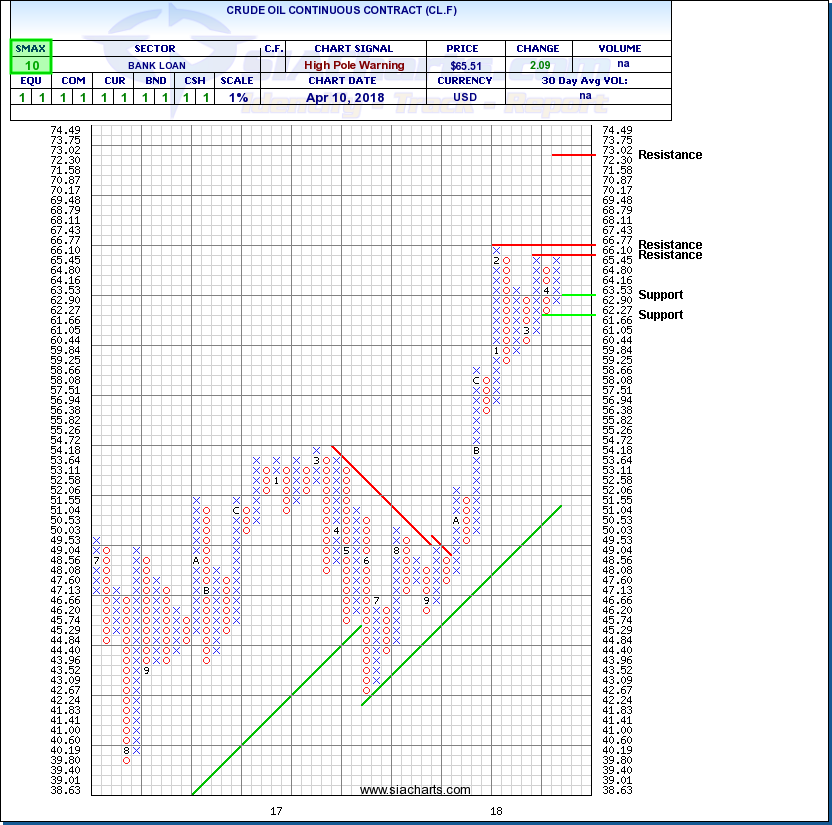
Crude Oil Continuous Contract (CL.F)
The price of Crude Oil continues to steadily climb. Higher lows on the chart indicate ongoing accumulation. A perfect SMAX score of 10 indicates oil is exhibiting strong performance across all asset classes.
Oil fell last week on fears that a US-China trade war could curtail energy and resource demand but with China indicating plans to open up its economy, fears have subsided and oil has rebounded approaching its highest levels in years. Meanwhile, increasing tensions in the Middle East including the threat of a US missile strike in Syria, missiles being launched at Saudi Arabia and growing tensions between several countries and Iran have stoked the flames of political uncertainty have also boosted oil prices. US inventories have been all over the map with last week’s surprise drawdowns offset by this week’s surprise increases.
WTI recently regained the $65.00 level and faces resistance in the $66.10 to $66.77 zone near pervious highs. A breakout would complete a bullish Spread Double Top that would signal the start of a new upleg. Next potential measured resistance could than appear near $73.02 based on a horizontal count. Initial support appears near $62.90 then $61.66.
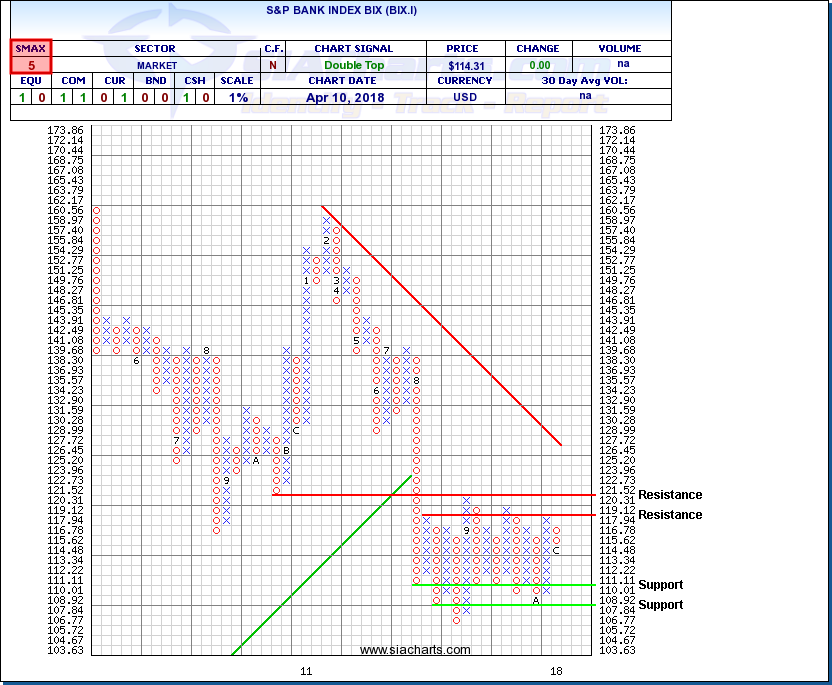
S&P Bank Index (BIX.I)
US banks kick off earnings season on Friday the 13th with JPMorgan Chase, Citigroup and Wells Fargo all scheduled to report results. To date, Financials have been impacted less negatively by rising interest rates than other interest rate sensitive sectors like Utilities or Real Estate but that may not last forever. Investors may look to these results and any outlook comments from management for signs of when the impact of higher rates may catch up to the banking sector.
The S&P bank Index has been bouncing back and forth in a range between approximately 107.50 and 121.50. Recently the index has been sliding within this range, as indicated by the current column of Os on the chart. The SMAX score of 5 indicates mixed to weakening performance across the asset classes. It appears that there has been some caution emerging toward the banks into the results and any big disappointments could accelerate capital flows out of the sectors. On the other hand if the banks manage to beat lowered expectations, the stage could be set for relief rallies. Whatever direction the index breaks from the current congestion zone could set the trend for some time to come.
SIACharts.com specifically represents that it does not give investment advice or advocate the purchase or sale of any security or investment. None of the information contained in this website or document constitutes an offer to sell or the solicitation of an offer to buy any security or other investment or an offer to provide investment services of any kind. Neither SIACharts.com (FundCharts Inc.) nor its third party content providers shall be liable for any errors, inaccuracies or delays in content, or for any actions taken in reliance thereon.
For a more in-depth analysis on the relative strength of the equity markets, bonds, commodities, currencies, etc. or for more information on SIACharts.com, you can contact our sales and customer support at 1-877-668-1332 or at siateam@siacharts.com.
Copyright © SIACharts