by Fei Mei Chan, Director, Index Investment Strategy, S&P Dow Jone Indices
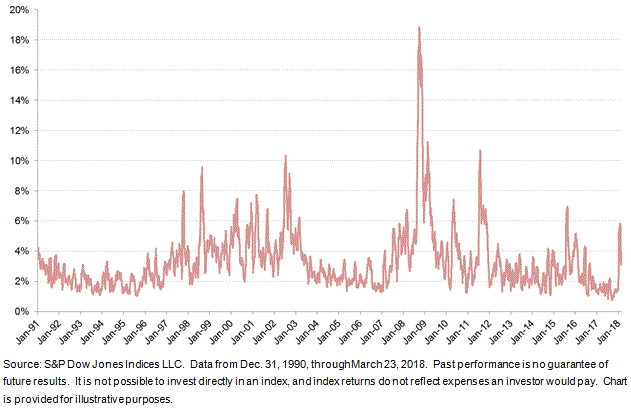
Although market volatility has retreated somewhat since the spike in early February, it has remained elevated. In the last 30 trading sessions, the S&P 500 moved by more than 1% (in either direction) 14 times.
VOLATILITY FOR S&P 500 (21-Day Rolling)

Volatility manifests itself in both dispersion (a measure of the magnitude of differences among an index’s constituent returns) and correlation (the tendency of assets to move in the same direction at the same time). This means that observing combinations of dispersion and correlation can give us some insight into the dynamics of market volatility.
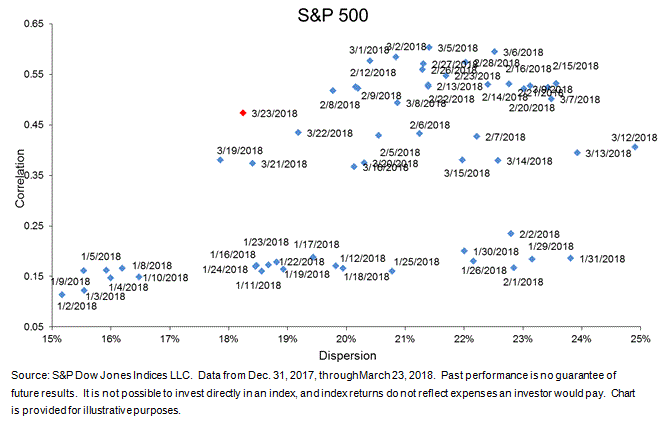
In February, we put the markets’ record decline—and spike in volatility—in the context of the dispersion-correlation map. The chart below provides an update of where we currently stand in this framework. Immediately following the S&P 500’s 4.1% drop on February 5th, both dispersion and correlation jumped significantly. In the days following, both measures climbed further before they started to retrace. Currently, correlation remains elevated but dispersion is much closer to the levels we saw in January.
ROLLING 21-DAY DISPERSION-CORRELATION YEAR TO DATE

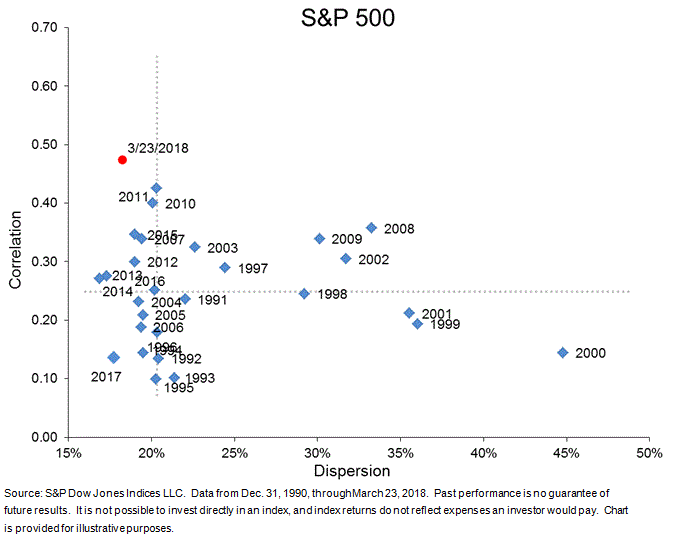
In context of broader history, dispersion is below the median measured from 1991 through 2017 (annual levels are averages of monthly figures), though correlation is still well above median. Things are no longer tranquil like they were in 2017, but we’re also far removed from tumultuous years like 2000 and 2008 when dispersion levels were much higher.
DISPERSION-CORRELATION MAP

Copyright © S&P Dow Jone Indices


