
by John Lynch Chief Investment Strategist, Jeffrey Buchbinder, CFA Equity Strategist, LPL Financial
Our favorite leading indicators are signaling that further economic growth and stock market gains lie ahead. With the bull market celebrating its ninth birthday on March 9, we looked at some of our preferred leading economic and bull market indicators. We included LPL Research’s proprietary “Over Index” and two of the Five Forecasters (the Conference Board’s Leading Economic Index and stock market breadth), in an effort to help assess the likelihood that the bull market will reach its tenth birthday in a year. This week, we will look at the remaining three forecasters: the Treasury yield curve, the Institute for Supply Management (ISM) Manufacturing Index, and stock valuations. Historically, these indicators—which are summarized in our Recession Watch Dashboard —have collectively signaled a transition to the latter stages of the economic cycle and an increased potential of an oncoming recession and bear market.
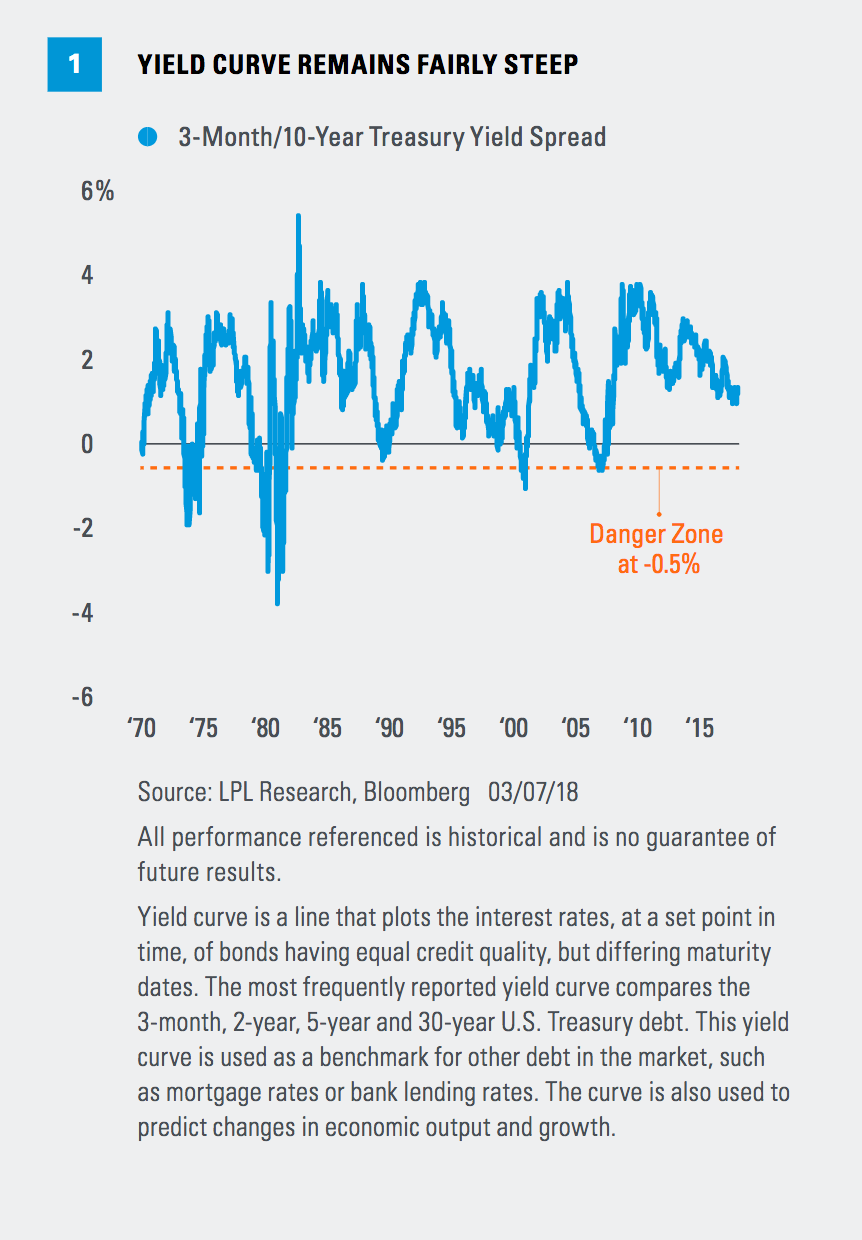
TREASURY YIELD CURVE: NO WARNING
Bull markets have historically ended (and bear markets have begun) when the Federal Reserve (Fed) has pushed short-term interest rates above long-term rates, which is often referred to as “inverting the yield curve.” For example, the S&P 500 Index peaked in 2000 and 2007 when the 3-month to 10-year Treasury yield curve was inverted by about 0.5% (3-month Treasury yields were roughly 0.5% above the yield on the 10-year Treasury note).
The yield curve is considered one of the most reliable leading indicators because every recession over the past 50 years has been preceded by the Fed hiking rates enough to invert the yield curve — 7 out of 7 times. The yield curve inversion usually takes place about 12 months before the start of a recession, but lead times vary, ranging from about 5–16 months. (We discussed lead times here.)
FIVE FORECASTERS
Because every cycle is different, there is no magic formula for predicting recessions and bear markets. But we believe the Five Forecasters cover a variety of perspectives, including economic, market, fundamental, valuation, and technical/sentiment, to capture a more complete view of the economic and market environment. They are meant to be considered collectively, not individually.
The peak in the stock market has historically come around the time of the yield curve inversion, and ahead of the recession and accompanying downturn in corporate profits.
With the 3-month and 10-year Treasuries currently yielding 1.67% and 2.89%, respectively, the Fed must push up short-term rates by more than 1.7%, assuming a constant 10-year yield, to invert the yield curve by 0.5%. The roughly seven hikes of 0.25% each that would be necessary to push the fed funds rate over 3.4% may still be two years away, if not more. Although the 10-year yield could always fall and the Fed could speed up its pace of rate hikes, the steepness of the curve combined with the historical lag time until recessions start suggest that this reliable indicator may not provide a worrisome signal for quite some time [Figure 1].
EXPANSION HIGH FOR ISM
Earnings are the most fundamental driver of the stock market, and should be a part of any recession or bear market watch checklist in our opinion. The ISM Manufacturing Index has historically been a good earnings indicator, with a six-month lead time [Figure 2]. For example, the peak in the ISM that occurred in late 2014 indicated an ensuing slowdown in profits. Since purchasing managers are on the front line when it comes to the manufacturing supply chain, and the ISM surveys future plans, they can provide signals of economic turning points ahead. With the majority of S&P 500 profits tied to manufacturing, and even though manufacturing is a relatively small portion of the U.S. economy measured by gross domestic product, demand for manufactured goods has been a timely barometer for all types of economic activity in recent decades.
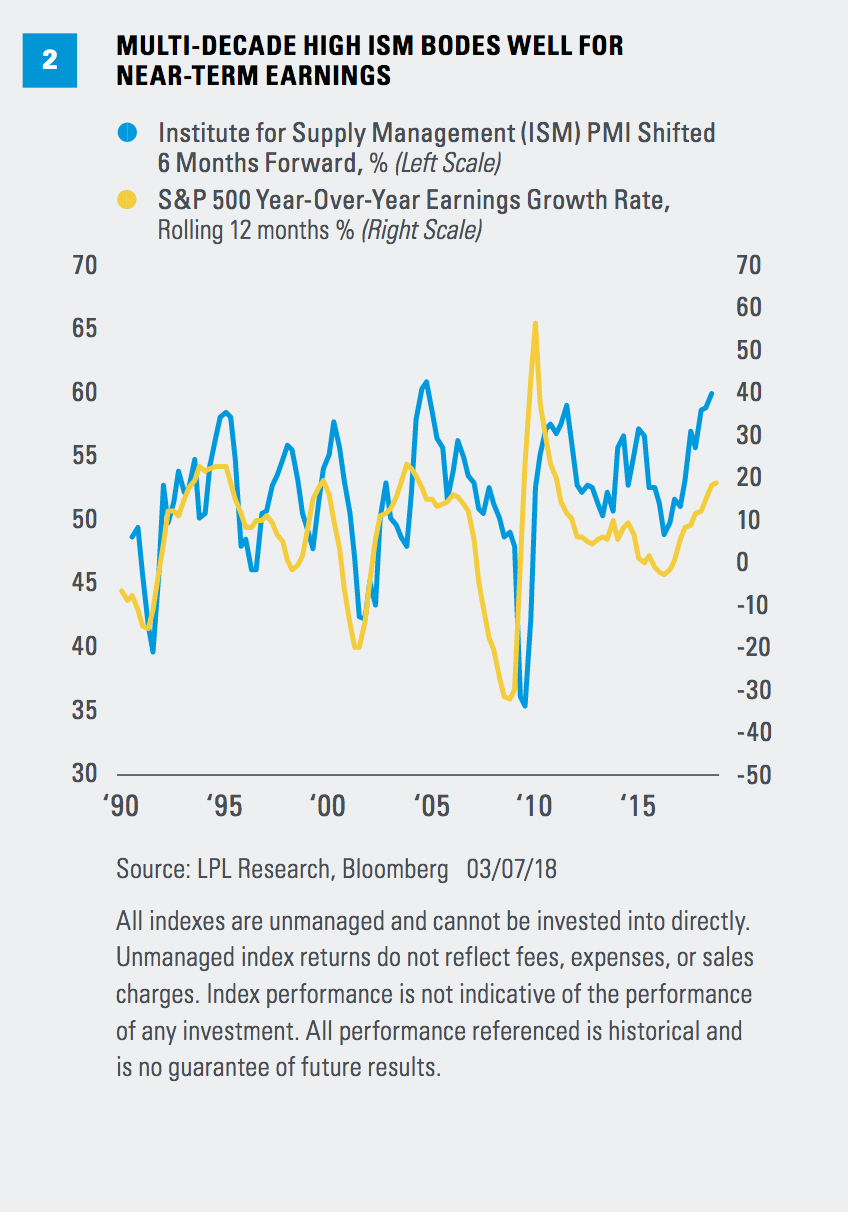
Currently, this indicator is signaling that solid manufacturing activity and robust earnings growth are ahead with no sign yet of a meaningful peak. Historically, on average, recessions do not start until nearly four years after manufacturing peaks, as we discussed here. The February reading (60.8) was the highest since 2004 and significantly above 50, which is the level that indicates contraction. Manufacturing sentiment is being supported by several factors, including overall expectations for improving U.S. and overseas economic growth, a weak U.S. dollar, corporate tax cuts, and 100% expensing of capital equipment.
Positive earnings estimate revisions, even excluding the impact of the new tax law, also suggest that additional earnings gains may be ahead.
STOCK VALUATIONS: ON WATCH
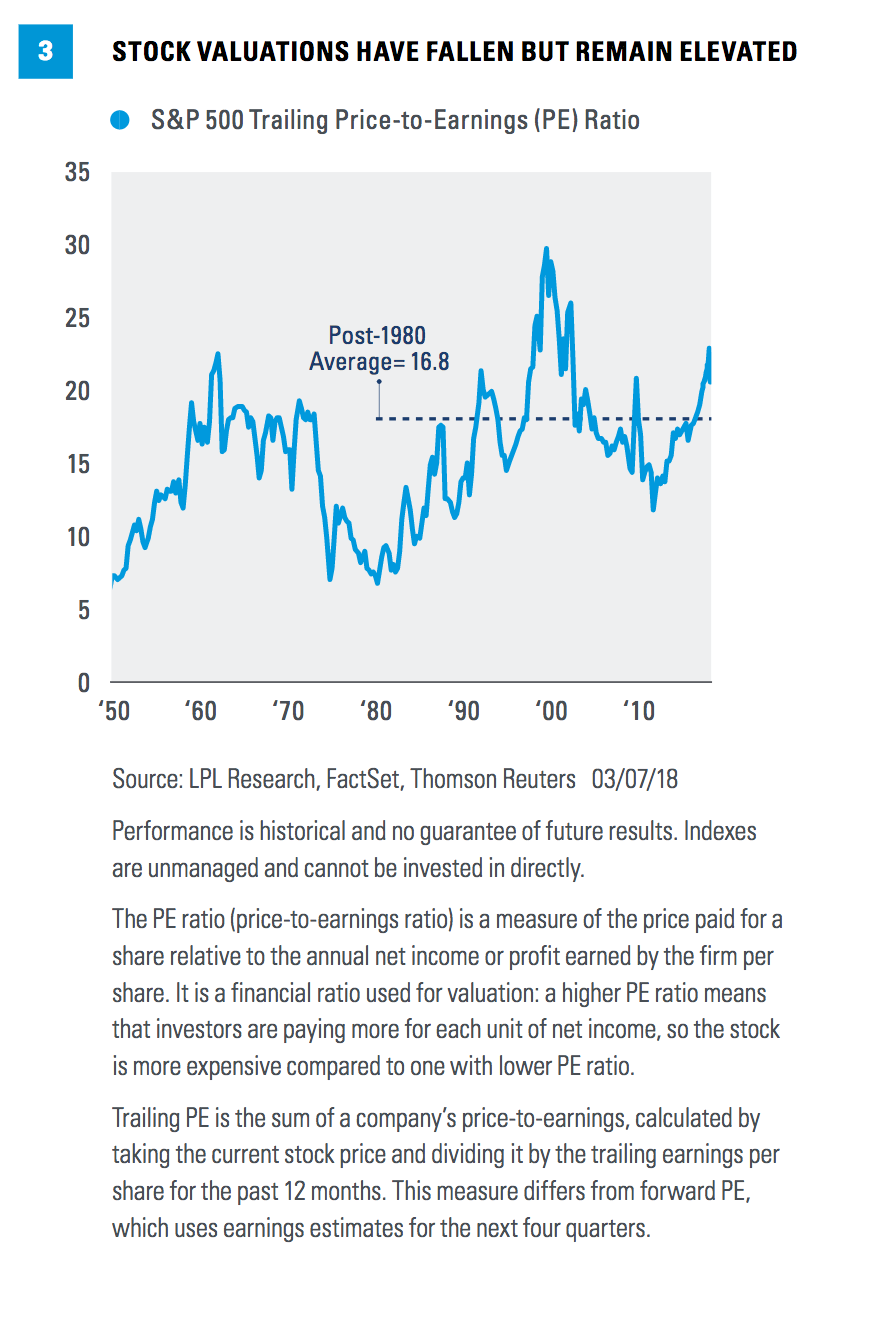
Stock valuations have not historically been effective short or intermediate investment timing tools, though they have been solid indicators of long-term stock returns and can be useful in a strategic context. That said, price-to-earnings (PE) ratios have been high historically when bull markets have ended. High valuations can tell us that the stock market may be more vulnerable to deterioration in the economic cycle. A higher PE implies a more optimistic earnings outlook, which introduces more risk of disappointment if that growth outlook does not materialize.
The strong double-digit earnings gains in 2017 and accompanying big gains in the stock market have pushed the S&P 500 PE ratio on a trailing four quarters basis up to a historically high level of around 20, down from 23 at the S&P 500 peak on January 26, 2018. That level is sufficiently high to check the box for an elevated valuation condition, suggesting an above-average bear market decline when the catalyst arrives. However, keep in mind earnings estimates for 2018 have risen significantly this year. As those estimates are potentially met—or even approximated—over the course of this year, assuming stocks do not go a lot higher, the trailing PE ratio for the S&P 500 may come down. The resulting trailing PE ratio may be in the 17–18 range, near long-term averages [Figure 3]. Also note that stock valuations, when compared against current levels of inflation and interest rates, do not appear as threatening.
Bottom line, we are reassured by a lack of negative signals from other leading indicators and potentially only slightly elevated valuations at year-end as earnings ramp up.
CONCLUSION
Our favorite economic and stock market indicators, including the ISM Manufacturing Index and the yield curve, suggest further economic growth and stock market gains may be ahead. While stock market valuations are on the high side, a characteristic of late-stage bull markets, PE ratios have not historically been an effective market timing tool. Further, as earnings ramp up in 2018, assuming stocks do not go significantly higher, valuations may come down. Broadly, these indicators —including the ones discussed here—give us confidence that we may be celebrating the tenth birthday of this bull market one year from now. •
******
IMPORTANT DISCLOSURES
The opinions voiced in this material are for general information only and are not intended to provide specific advice or recommendations for any individual. To determine which investment(s) may be appropriate for you, consult your financial advisor prior to investing. All performance referenced is historical and is no guarantee of future results. The economic forecasts set forth in the presentation may not develop as predicted and there can be no guarantee that strategies promoted will be successful. Investing in stock includes numerous specific risks including: the fluctuation of dividend, loss of principal, and potential liquidity of the investment in a falling market. All investing involves risk including loss of principal. Because of its narrow focus, investing in a single sector, such as energy or manufacturing, will be subject to greater volatility than investing more broadly across many sectors and companies.
DEFINITIONS
Gross domestic product (GDP) is the monetary value of all the finished goods and services produced within a country’s borders in a specific time period, though GDP is usually calculated on an annual basis. It includes all of private and public consumption, government outlays, investments, and exports less imports that occur within a defined territory.
INDEX DESCRIPTIONS
The Standard & Poor’s 500 Index is a capitalization-weighted index of 500 stocks designed to measure performance of the broad domestic economy through changes in the aggregate market value of 500 stocks representing all major industries.
The Institute for Supply Management (ISM) Index is based on surveys of more than 300 manufacturing firms by the Institute for Supply Management. The ISM Manufacturing Index monitors employment, production inventories, new orders, and supplier deliveries. A composite diffusion index is created that monitors conditions in national manufacturing based on the data from these surveys.
Copyright © LPL Financial