by Randy Frederick, VP, Trading and Derivatives, Charles Schwab and Company
The period between November 2016 through the end of January 2018 was an unprecedented period for investors. Equities rose sharply and volatility was historically low. In 2017 alone, the Cboe Volatility Index® (VIX®), a measure of the expected volatility in the S&P 500® Index 30 days into the future, closed below 10 points far more times than in any other year in its 25-year history. Not only was volatility low, but the S&P 500 gained more than 34% after going more than 18 months without even a 5% pullback, and a full 24 months without a 10% correction.
Then in February 2018, the law of averages caught up with the market, and the S&P 500 declined 10.1% from its January peak—its first correction since January 2016.
There is little doubt the correction was overdue statistically, but it was also driven by a number of factors, including rising volatility expectations in a market that was hitting record highs, rising inflation expectations, excessive investor optimism, rising interest rates, concerns about Federal Reserve monetary policy, weak Treasury auction results, government shutdown concerns, and an increasingly crowded short volatility strategy used by certain institutional participants. While many of these signs had been present for several months, pinpointing the tipping point that sparks a correction is very difficult—thus many investors were caught off-guard.
Warning or opportunity?
Clearly, even diversified investors will experience some losses in their portfolios when the market declines and volatility spikes, but are such spikes a warning sign of more trouble to come? Or can they be a sign of opportunity for investors seeking to put uninvested cash to work in the market?
In the early 1800s, British banker Baron Rothschild is credited with saying “the time to buy is when there’s blood in the streets.” Eponymous mutual fund company founder Sir John Templeton is said to have used the philosophy of buying companies when they hit the “point of maximum pessimism.” And finally, the man often referred to as the “Oracle of Omaha,” Warren Buffett, is known for saying, “Be fearful when others are greedy and greedy when others are fearful.” All three of these highly successful investors had one thing in common: They were all contrarians.
However, these investing philosophies are not just about buying market pullbacks or corrections, but of capitalizing on, rather than succumbing to, the fear of others. In order to do that, one must have some way to measure the fear, and know when that fear has hit an extreme. One gauge in the marketplace that many investors equate with fear is the VIX, which some people (though not me) actually refer to as the “fear index.”
Of course buying when others are fearful and being a contrarian investor is easier when you have the kind of investing capital and extremely long time horizons these three gentlemen had. Can it also be effective for regular investors with shorter-term outlooks?
To find out, I took a look at all spikes in volatility over the past 25 years, and separated them into two groups: significant VIX closes above 30 points and extreme VIX closes above 40 points. Because spikes in volatility tend to last several days or several weeks, but don’t always stay fully above the initial level, I considered any spike in which the VIX remained within five points of the initial spike level (that is 25 or higher for VIX spikes to 30 and 35 or higher for VIX spikes to 40) as a single instance. Once the VIX dropped more than five points from the initial spike, any subsequent spike above the threshold was viewed as a new and unique spike.
What happens after significant spikes in the VIX above 30?
Significant spikes in the VIX that result in a closing level above 30 can be caused by a variety of different factors, but historically they have never occurred without a concurrent drop in equity prices. As you can see in the table below, for each initial closing spike in the VIX above 30, the S&P 500 did very well over the course of the following calendar week, averaging 1.2% over the 21 instances that it happened, although past performance is no guarantee of future results. Thirteen out of 21 times, the market went up and the only periods in which losses exceeded 1% were in September 2001 (World Trade Center attack), July 2002 (dot-com-bubble bear market) and August 2011 (U.S. government credit rating downgrade by S&P).
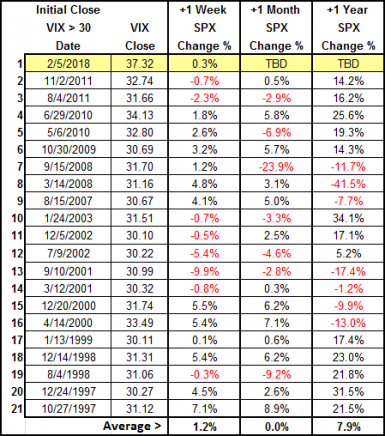
Source: Schwab Center for Financial Research. Weekly and monthly returns are actual, not annualized. Past performance is no guarantee of future results.
One month following these same spikes, the average return for the S&P 500 was breakeven. Thirteen of 20 times the market went higher, but significant losses were incurred during the bear market in August 1998 and during the financial-crisis bear market in September 2008.
Finally, one year following these same spikes, the S&P 500 showed an average annual return of 7.9%. Only during the dot-com-bubble bear market of 2000-03 and the financial-crisis bear market of 2007-09 were any losses incurred.
What happens after extreme spikes in the VIX above 40?
While far less common than spikes above 30, extreme spikes in the VIX that result in a closing level above 40 can also be caused by a variety of different factors, but they too historically have never occurred without a sharp drop in equity prices. As you can see in the table below, one week following the first VIX close above 40, the average S&P 500 return was 2% over the eight occurrences, and the return was positive five out of eight times. As you might expect, the one notable outlier was during the steepest drop, amid the financial crisis bear market in September 2008. Excluding this one instance, the average would increase to 2.9%.
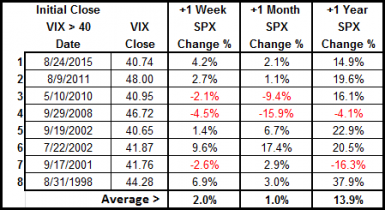
Source: Schwab Center for Financial Research. Weekly and monthly returns are actual, not annualized. Past performance is no guarantee of future results.
One month following these same extreme spikes, the S&P 500 had an average return of 1%. Six of eight times the market went higher, but the financial crisis bear market in September 2008 was the notable outlier again. Excluding this one instance, the average would increase to 3.4%.
Finally, one year following extreme volatility spikes, the S&P 500 had an average annual return of 13.9%. As the bear market only lasted about eight months, a year after the worst part of the 2008 financial crisis, the worst of the declines were mostly over. However, amid the dot-com-bubble bear market, which lasted about 19 months, 2001 was the only year to incur a significant loss. Excluding this one instance, the average would increase to 18.3%.
What’s the bottom line?
I think it is important to note here that in both the dot-com-bubble bear market and the financial crisis bear market, the first spike in the VIX above 40 occurred after the S&P 500 had already entered bear market territory (down 20%). Of course we all know that past performance is no guarantee of future results, but if significant or extreme spikes in the VIX do accompany investor fear in any sense, buying (at least over the past 20 years) “when others are fearful” has had a relatively positive outcome, with the S&P 500 rising on average 1.2% in the week following a VIX spike above 30 and rising 2% in the week following a VIX spike above 40. And with a little extra effort at avoiding those instances where an obvious bear market has already begun, the results can be improved even more.
Perhaps the Baron, Sir John and the Oracle are indeed deserving of the reverence which we often bestow upon them.
Copyright © Charles Schwab and Company