


What a wild ride we have had in the equity markets this past week. Let’s take a look at how the Broad indexes have fared in the past week in light of what we all witnessed most recently. Last week, we looked at the S&P 500 Index so this week we will examine the Dow Jones Industrial Index (DJI.I). We will also examine the volatility index or VIX chart to see how it behaved during this same time frame.
CBOE SPX Volatility Index (VIX.I)
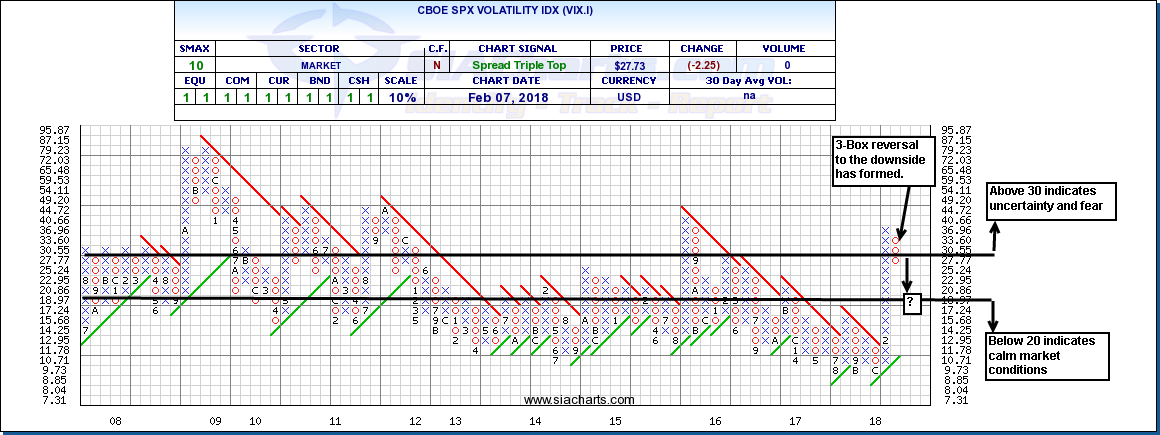
The (CBOE) Volatility Index (VIX) has become the most popular method of measuring expected volatility. The VIX shows the market’s volatility expectations for the next 30 days and does this by tracking both Put and Call options on the S&P 500 Index. Volatility is a measure of how quickly or slowly prices change, and many investors watch this index for extreme volatility because it is generally believed that when the market hits these extremes, it reverses course. For some rules of thumb parameters, a VIX below 20 indicates calm market expectations, and above 30 signals high uncertainty and fear in the markets.
First let’s examine the chart of the Volatility Index to see how it has behaved most recently. In the attached chart, we can see that the VIX.I was in an extended period of very low volatility from the fall of 2015 to earlier this year which translated into very stable and calm equity markets for almost 2 years running. In this past week the Index spiked to extreme levels not seen since the summer of 2015 surpassing the 30 reading which can signal high uncertainty and fear in the markets. Now after its initial run up. we see the Index has reversed and a 3-box reversal has formed to the downside.
Only time will tell if the index will continue to trend downward to the 20 reading or below leading to a more orderly market condition. Now let’s take a look at the Dow to see how it has behaved in this increased volatile environment.
Dow Jones Industrial Average (DJI.I)
Last week may come down as one to remember for quite some time with the recent trading action of the equity markets, particularly this past Friday and Monday. Monday saw the Dow Jones plummet as much as 800 points in 5 minutes, but then able to recover much of that loss just a few short minutes afterwards. This phenomenon is labelled as a “Flash Crash” which may be attributed to the onset of Algorithmic trading that is becoming more and more a part of how trades are being executed through our exchanges. Perhaps the catalyst for this market sell off was the strong jobs numbers coming out of the US last Friday sparking concern the US Federal Reserve may consider hiking interest rates at a quicker rate than anticipated. Needless to say, let’s take at the Chart of the Dow Jones Industrial Index (DJI.I) to see how it has been affected during the flash crash of Feb 5th.
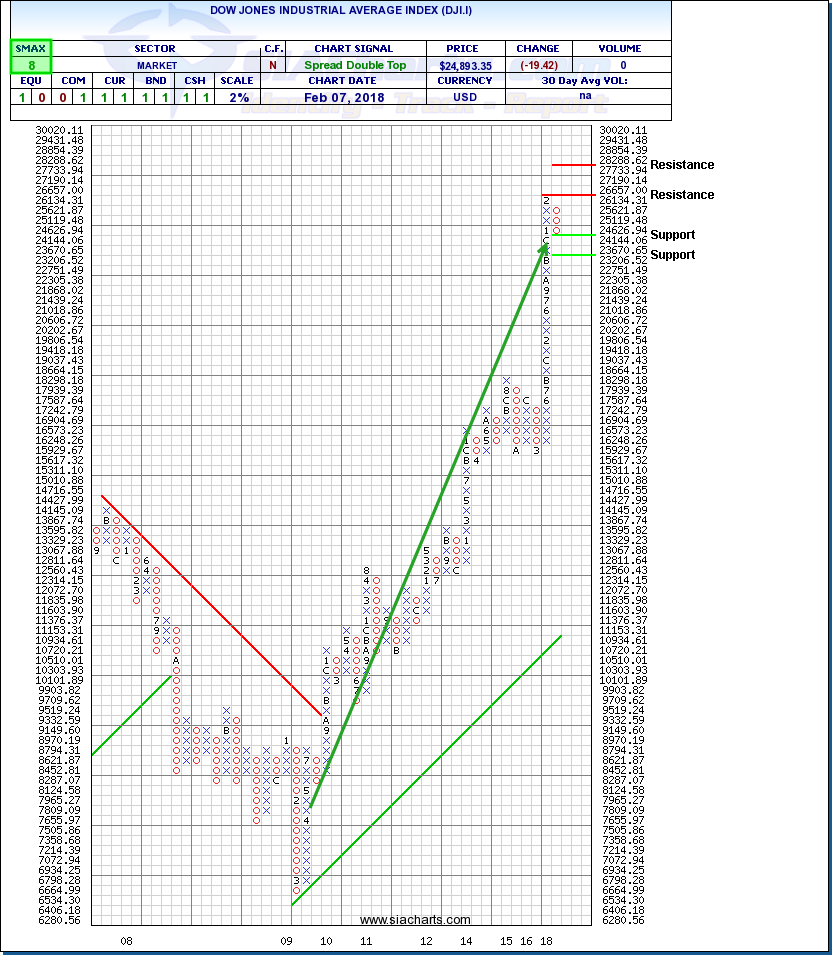
The last time we looked at the chart of DJI.I was on Dec 21, 2017. The Dow ended 2017 strong and this strength continued until last week when the market downturn started to materialize. However, in looking at the attached chart of DJI.I we see that yes, indeed, a 3-box reversal has formed. Having said that, the long-term uptrend which has been in place since 2009 is still well intact. No material damage to the overall chart has formed as of yet. Only time will tell if this pullback continues further.
It is quickly approaching its first level of support at 24,144 and, below that, much stronger support at 23,206. If the markets continue to stabilize like we saw yesterday, resistance can be found at the old high earlier this year at 26,657. It it manages to break above this level of resistance, the next area of resistance can be found at approximately the 28,000 area. With an SMAX of 8 out of 10, the Dow is still showing near term strength against most asset classes.
SIACharts.com specifically represents that it does not give investment advice or advocate the purchase or sale of any security or investment. None of the information contained in this website or document constitutes an offer to sell or the solicitation of an offer to buy any security or other investment or an offer to provide investment services of any kind. Neither SIACharts.com (FundCharts Inc.) nor its third party content providers shall be liable for any errors, inaccuracies or delays in content, or for any actions taken in reliance thereon.
For a more in-depth analysis on the relative strength of the equity markets, bonds, commodities, currencies, etc. or for more information on SIACharts.com, you can contact our sales and customer support at 1-877-668-1332 or at siateam@siacharts.com.