by Russ Koesterich, Portfolio Manager, Blackrock Investments
Russ discusses why the real economy and financial market conditions offer more clues about volatility than political noise.
During the first four days of 2018, U.S. stocks rose 2.50% and the VIX Index, a measure of implied volatility, never closed above 10, very low by historical standards. For years, investors interpreted extreme low volatility readings as a warning sign; lately it has become the norm (see the accompanying chart). Whether this can continue depends less on external culprits such as the din out of Washington and more on the real economy and financial market conditions.
[Tweet "Today, neither a sharp deceleration in growth or recession appear likely. ~ Russ Koesterich"]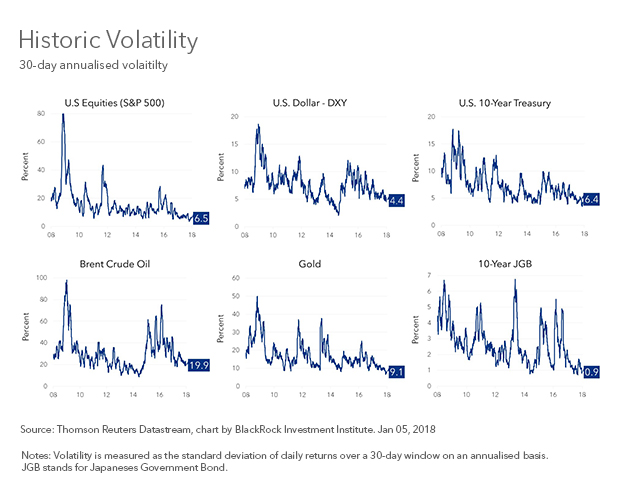
Back in August, I suggested that investors should tune out much of the sound and fury emanating from Washington. While financial markets are not immune to political strife, they have historically been more resilient than many imagine. Instead, what matters is whether political uncertainty translates into economic disruption. Thus far that has not happened, suggesting that the low volatility regime can continue.
Starting with the real economy, two things have historically impacted market volatility: the level and volatility of growth. Not surprisingly, sharp decelerations in growth or recessions are accompanied by more volatility. Today, neither appear likely.
Beyond the level of growth, the variation in growth also matters. Market volatility tends to be low when economic growth is steady. During the past 20 years, economic volatility, measured by my preferred measure, the Chicago Fed National Activity Index (CFNAI), explained 20% of the variation in the VIX Index. Today’s steady economy helps explain why financial market volatility has remained muted.
Beyond the real economy, the other big driver of market volatility is financial market conditions. Cheap and available money, evidenced by tight credit spreads, explains more than 50% of the variation in equity market volatility. Recently spreads have been declining from already low levels. Since last discussing volatility in August, high yield spreads have narrowed by another 35 basis points (bps, or .35% points). This is the other reason why a sub-10 VIX has become so commonplace.
Things to watch
For now it would appear that the low volatility regime is likely to remain in place. What might change that? Last week I suggested watching credit markets, which are often the first to react to changes in the environment. This leaves the question: What might disrupt credit markets? A precursor to any change is likely to take the form of either too much or too little growth.
On the latter, watch China. I expect the Chinese economy to gently decelerate during the course of the year. However, a quicker drop, perhaps to sub-6% growth, would be a problem.
The other potential disrupter is the opposite—too much growth, or more particularly an unexpected acceleration in U.S. inflation.
For now inflation remains tame, but work by the BlackRock Investment Institute suggests some mean reversion in U.S. core inflation during the course of the year. Some acceleration has already been reflected in the bond market; witness the recent rise in U.S. TIPS breakeven rates. However, should inflation start to move meaningfully above 2%, the low volatility regime is unlikely to survive.
Russ Koesterich, CFA, is Portfolio Manager for BlackRock’s Global Allocation team and is a regular contributor to The Blog.
*****
Investing involves risks, including possible loss of principal. Fixed income risks include interest-rate and credit risk. Typically, when interest rates rise, there is a corresponding decline in bond values. Credit risk refers to the possibility that the bond issuer will not be able to make principal and interest payments. Non-investment-grade debt securities (high-yield/junk bonds) may be subject to greater market fluctuations, risk of default or loss of income and principal than higher-rated securities.
This material is not intended to be relied upon as a forecast, research or investment advice, and is not a recommendation, offer or solicitation to buy or sell any securities or to adopt any investment strategy. The opinions expressed are as of January 2018 and may change as subsequent conditions vary. The information and opinions contained in this post are derived from proprietary and nonproprietary sources deemed by BlackRock to be reliable, are not necessarily all-inclusive and are not guaranteed as to accuracy. As such, no warranty of accuracy or reliability is given and no responsibility arising in any other way for errors and omissions (including responsibility to any person by reason of negligence) is accepted by BlackRock, its officers, employees or agents. This post may contain “forward-looking” information that is not purely historical in nature. Such information may include, among other things, projections and forecasts. There is no guarantee that any forecasts made will come to pass. Reliance upon information in this post is at the sole discretion of the reader. Past performance is no guarantee of future results. Index performance is shown for illustrative purposes only. You cannot invest directly in an index.
©2018 BlackRock, Inc. All rights reserved. BLACKROCK is a registered trademark of BlackRock, Inc., or its subsidiaries in the United States and elsewhere. All other marks are the property of their respective owners.
Copyright © Blackrock Investments