by Ryan Detrick, Senior Market Strategist, LPL Research
With the S&P 500 Index flirting with a gain of 20% for the year, one technical formation took place in 2016 that was a clue that we could be in for solid gains. But before we get to that, below are some of our blog posts from earlier this year that suggested 2017 could shape up to be a banner year:
- When the S&P 500 is up more than 1% after the first five days of the year, the full year is higher 88.5% of the time and up 15.1% on average.
- When the S&P 500 is higher in January, the next 11 months are higher 88% of the time and up 12.1% on average.
- If the S&P 500 is higher in both January and February, the full year has been higher 25 out of 26 times and up 19.5% on average.
- When the S&P 500 is up more than 5% in the first quarter, the final 9 months gain another 9.6% on average and are higher 87.5% of the time.
- Finally, when the S&P 500 is up by more than 8% at the midpoint of the year, the final six months are higher 21 out of 25 times.
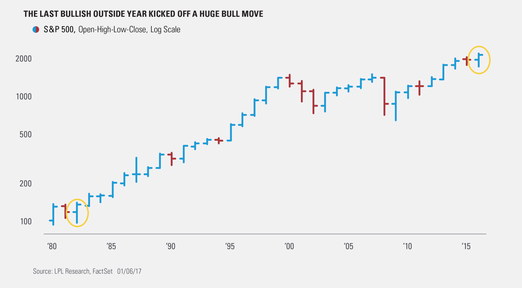
Turning to the technicals, 2016 saw the S&P 500 trade below the 2015 low and above the 2015 high, before closing above the peak in 2015. Although that sounds quite confusing, this rare formation is called a bullish outside year. The previous two times this happened were in 1935 and 1982, with gains of 27.9% and 17.3% the next year, respectively.* Per Ryan Detrick, Senior Market Strategist, “The sample size is so small that your high school stats teacher would probably claim the results weren’t significant and should be ignored. But to us, the outside year in 2016 was yet another small clue that the bull market would continue in 2017.” Below is a chart that we shared back in January that paints the picture.
We hope you’ll frequent the blog next year, as we continue to find actionable investments, backed with quantified data.
IMPORTANT DISCLOSURES
* Please note: The modern design of the S&P 500 stock index was first launched in 1957. Performance back to 1928 incorporates the performance of its predecessor index, the S&P 90.
Past performance is no guarantee of future results.
The opinions voiced in this material are for general information only and are not intended to provide or be construed as providing specific investment advice or recommendations for any individual security.
The economic forecasts set forth in the presentation may not develop as predicted.
Investing in stock includes numerous specific risks including: the fluctuation of dividend, loss of principal and potential illiquidity of the investment in a falling market.
There is no guarantee that a diversified portfolio will enhance overall returns or outperform a nondiversified portfolio. Diversification does not ensure against market risk.
The Standard & Poor’s 500 Index is a capitalization-weighted index of 500 stocks designed to measure performance of the broad domestic economy through changes in the aggregate market value of 500 stocks representing all major industries.
All market indices discussed are unmanaged and are not illustrative of any particular investment. Indices do not incur management fees, costs and expenses, and cannot be invested into directly.
This research material has been prepared by LPL Financial LLC.
To the extent you are receiving investment advice from a separately registered independent investment advisor, please note that LPL Financial LLC is not an affiliate of and makes no representation with respect to such entity.
Not FDIC/NCUA Insured | Not Bank/Credit Union Guaranteed | May Lose Value | Not Guaranteed by any Government Agency | Not a Bank/Credit Union Deposit
Securities and Advisory services offered through LPL Financial LLC, a Registered Investment Advisor Member FINRA/SIPC
Copyright © LPL Research


