


What Happened to Inflation?
And What Happens if it Comes Back?
by Ben Inker, GMO LLC
A year ago, the US economy seemed poised for a significant shift. On one hand, inflation was running at the Fed’s target level, unemployment hovered around most estimates of full employment, and a new president was coming in promising a fiscal boost and policies designed to increase economic growth. On the other hand, after close to a decade of doing everything it could to boost the economy, the Federal Reserve was promising to, if not take away the punchbowl, at least begin diluting the alcohol content.
Something looked likely to give, in a way that would give us a significant clue as to whether interest rates would ever be able to go back to the levels that we all used to think of as normal. The year has actually turned out to be more confusing than expected, playing out in a way that did not align with either of our scenarios. This leaves us with continued uncertainty about where interest rates will wind up. But it also leaves me, at least, increasingly convinced that a significant inflation shock would be just about the worst thing that could happen to today’s investment portfolios.
Unlike most of history, it seems plausible that a meaningful inflation increase from here would impose worse losses on portfolios than a depression would. Depressions are bad for risk assets and good for high quality bonds. Inflation is very bad for high quality bonds and modestly bad for stocks. Today, not only would bonds do particularly badly given their very low real yields, but stocks could get hit worse than you’d otherwise expect given their high valuations. The saving grace from inflation-driven losses is that they would primarily come from a fall in valuations, not impairments to future cash flows.
As a result, we wouldn’t be all that much poorer if we judge by the amount of future spending a portfolio could sustainably support. But the loss of paper wealth could be massive. This doesn’t mean such an inflation surge is inevitable, or even particularly probable. It is, however, something that investors should have in the forefront of their minds when they think about what could go wrong for their portfolios.
What have we learned about Purgatory and Hell?
I believed that we were going to learn a good deal about the probabilities of Purgatory and Hell because the recovery from the financial crisis seemed to finally be over. The US economy was around full employment, inflation was at the Federal Reserve’s preferred level, and the Fed was preparing to embark on a significant tightening cycle for the first time in over a decade.
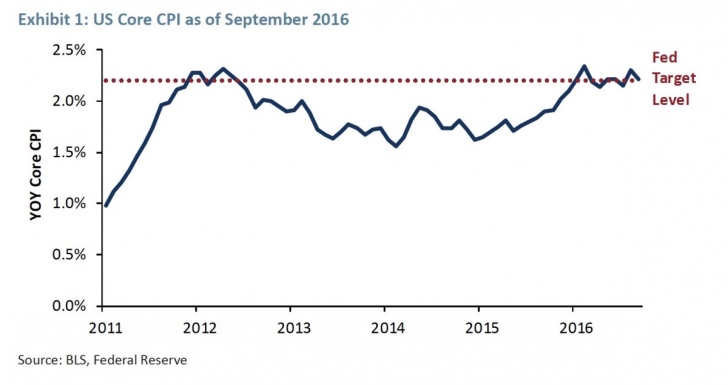
In the years when the economy was still stumbling through its slow recovery from the crisis, it was hard to really get a good feel for how close the economy was to its potential and how quickly inflation would return once spare capacity had been used up. But with the unemployment rate below 5% and inflation creeping up, it seemed we had worked our way through the lingering effects of the crisis. Exhibit 1 shows the core CPI as of the end of 2016, against an estimate of the Fed’s target level.1
After a long period of lower than target inflation, we seemed to be getting back on track. Similarly, GDP growth seemed to be in line with target levels, although perhaps trending a little soft versus the Fed’s estimate of potential GDP, as we can see in Exhibit 2.
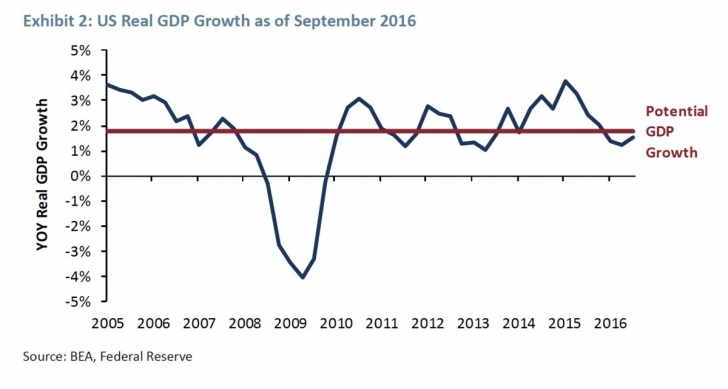
We had been running slightly under the Fed’s 1.8% estimate of potential GDP growth. For a secular stagnationist, this could have been seen as evidence that the economy was beginning to soften again, presaging a dip into recession if the Federal Reserve were to go ahead with its plan to raise rates.
1 The Fed’s preferred measure of inflation is the Personal Consumption Expenditure deflator, which averages a couple of tenths lower than CPI. Their target is 2%, so 2.2% on CPI is pretty much exactly on target.
Once you threw in the election and promises by the Trump administration for a large fiscal stimulus, it really did seem like a lot was going to become clearer pretty quickly. Exhibits 3 and 4 show what has happened to core CPI and GDP growth since last fall.
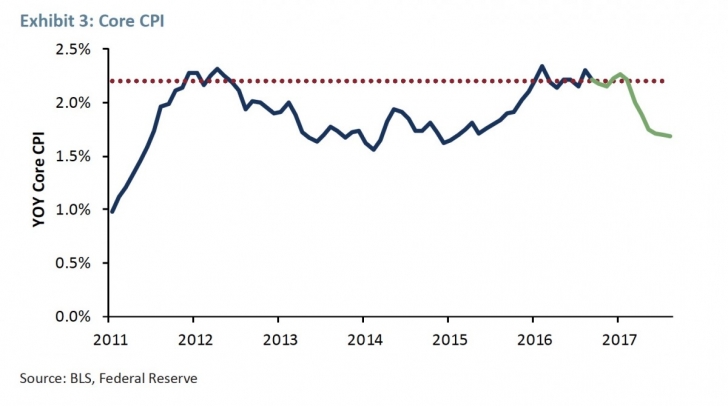
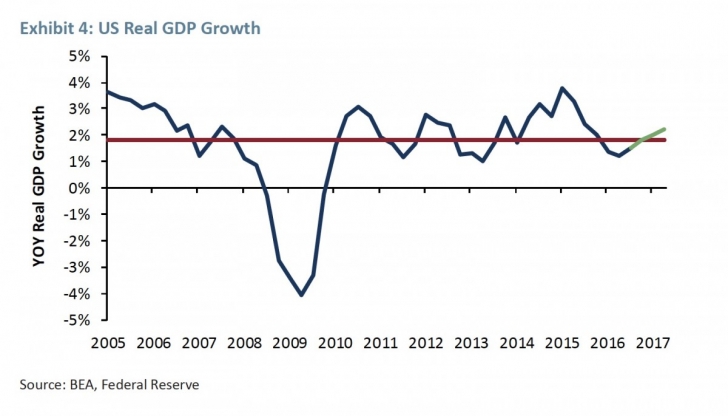
The Federal Reserve did indeed go ahead with its expected rate increases in December, March, and June. GDP growth, rather than soften as might have been expected if secular stagnation were correct, mildly strengthened. On the other hand, we would have expected inflation to either stay the same or rise, given GDP growth of around potential or better. The fall from 2.2% to 1.7% instead is somewhat mysterious.
Under most circumstances we wouldn’t care a lot about changes in inflation of this magnitude. Unless inflation becomes a real problem, we don’t believe that it materially impacts the future real cash flows available from most financial assets, so its impact on fair value is minor. Today, however, it has taken on a more central role in our thinking. When the economy was in recovery mode from the financial crisis, the secular stagnation versus gradual healing scenarios for the economy was a slightly academic argument, as it was hard to determine which was more accurate from the evidence we had.
From now on, however, the role of inflation seems utterly crucial to determining if we are in Purgatory or Hell. If, for whatever reason, inflation is permanently quiescent in the modern economy, the rationale for meaningfully higher interest rates is thin. Yes, higher real interest rates would give central banks more ammunition to fight future recessions, but we’ve seen from recent events that the zero bound, which economists assumed put a limit on how easy monetary policy could get, is more porous than we thought.
A central bank primarily concerned with keeping inflation on an even keel, let alone one that desires to encourage maximum employment given tame inflation, will tend to keep rates very low as long as it believes that inflation is not a threat. So whether inflation starts to rise again is extremely important for helping us determine whether short-term interest rates ever come back up to the good old days of perhaps 1% to 1.5% above inflation. Rising inflation does not have to mean an inflation problem.
If inflation were to push up to 2.5% to 3.0% in response to an economy continuing to grow steadily with low unemployment, this would not come as a shock to economists or the Federal Reserve. It would mean, however, that after a number of years of sub-normal inflation, the traditional rules of the economy still seem to hold and the Fed would have to raise rates at least in line with their current forecasts, or possibly a little higher.
This would push up bond rates, and, I believe, push down the general level of P/Es for stocks as well as valuations for real estate, infrastructure, private equity deals, and the like.
I have to admit that this is speculation on my part. Historically, there has not been a strong relationship between interest rates and valuations for real assets, and while inflation has impacted stock market P/Es, the impact has been modest for smaller changes in inflation. Using the model that Jeremy Grantham and I built years ago for explaining the Shiller P/E of the US stock market over time, an increase in inflation to around 2.5% would actually cause the valuation of the stock market to increase, not decrease.
When we built the original “Investor Comfort” model in the late 1990s, I solved for the market’s ideal level of inflation. It turned out to be 2.5% – any deviation from that level, whether up or down, caused the market to trade at a lower valuation.
My guess is that this is no longer the case. I’m not sure who coined the term “TINA” stock market, short for “There Is No Alternative,” but it does really feel as if that is a decent description for what is animating today’s stock market. Absent the excitement over the FAANG2 stocks, this seems to be about the least enthusiastic bull market in history.
There is no equivalent to the “great moderation” of the mid-2000s when investors seemed to truly believe that recessions were a thing of the past, nor the grand excitement about the internet driving away the clouds of ignorance as Alan Greenspan suggested during the late 1990s bull market. Apart from the FAANGs, there appears to be a sense that we all have to be invested in something and bonds and cash at current yields are more or less unownable.
The strong performance in recent years of low volatility stocks is consistent with my guess, as they have managed to keep up with S&P 500 despite the fact that they are neither exciting nor growthy, and have quite a low beta. They are, in short, exactly the type of group of stocks that should be expected to underperform in a bull market driven by excitement for the future or even a nice cyclical recovery. Their performance is shown in Exhibit 5.
2 Facebook, Amazon, Apple, Netflix, and Google (now Alphabet).
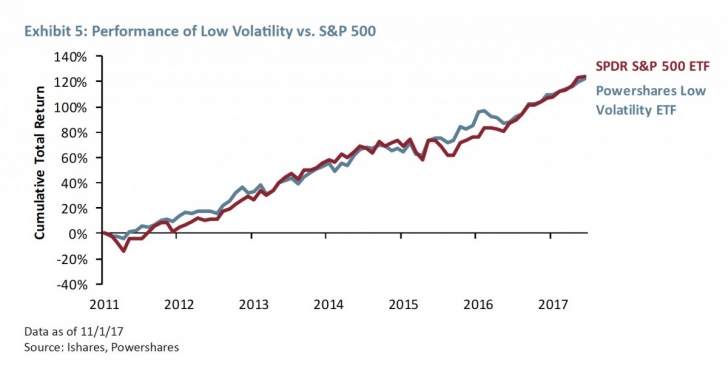
To be clear, this is in no way a recommendation for this ETF or low volatility portfolios in general. Low volatility stocks look relatively expensive to us – significantly pricier versus the market than they were on average during the decades before low volatility became fashionable. My point is simply that this is not a group that would be expected to keep up in an excitement-driven bull market, but might well hang in in a market driven by investors feeling forced into equities despite a lack of enthusiasm.
Jeremy Grantham looks at this environment and argues that we should be on the lookout for an actual excitement-style bubble to form now, and he may well be right. But the flip side is that an event that would not have particularly troubled an excitement-driven bull market – a modest rise in the expected return on low-risk assets – could have a more significant effect today. The transition from the TINA market to the TIAOA market – “There Is An Okay Alternative” might well be more problematic than our old model suggests.
What happens if there’s an inflation problem?
This all happens without an actual inflation “problem.” If inflation were to actually become a problem and head to, say, 4% to 6%, the Federal Reserve would have to raise rates much more aggressively. While such an event would be devastating to bonds under any circumstances and would be normally expected to hit stocks moderately as well, the potential pain today seems significantly greater. We then go from the TINA market to the TIAPDGA market as well as the DKAMATEAITID market – the “There Is A Pretty Darn Good Alternative” market and the “Don’t Know As Much About The Economy As I Thought I Did” market.3
The combination of bonds and cash suddenly yielding quite a bit in both nominal and real terms as well as much higher uncertainty about the future path of the economy seems likely to be utterly devastating to today’s high valuations. One simple way of thinking about that is asking what would be the fall in the S&P 500 if valuations were to fall to long-term median levels. Our favorite simple measure of value is Shiller P/E, but for those concerned about a “false” impact on valuations from the write-downs in the financial crisis, we can also look at the “Hussman P/E,” which compares real stock prices to the highest historical real earnings of the index (Exhibit 6).4
3 There may well be a reason why no one has ever picked up on my financial market acronyms to date.
4 The Hussman P/E was invented by John Hussman, an extremely prolific writer on markets as well as the founder of Hussman Funds. He did not name it after himself, just as Shiller did not actually name CAPE after himself.

Relative to traditional P/Es, Shiller P/E is biased high because earnings tend to grow over time and a 10-year average earnings figure will be, on average, lower than last year’s earnings. Hussman P/E is biased low, since it is always comparing the market to the highest earnings figure we’ve ever seen. But versus their long-term medians, both are telling precisely the same story – the S&P 500 is trading at about a 93% premium to the long-run median. Falling to median therefore involves a 48% fall.
That long-run median doesn’t feel like it has a lot of relevance these days. In the last 25 years, the S&P has spent somewhere between 6 and 13 months trading at or below the long-term median, depending on which version of normalized P/E you are looking at. That’s between 2% and 4% of the time, which sure doesn’t make it feel like a relevant median any more.
Historically, the three things that have dragged the market lower than median have been major wars, economic crises, and inflation spikes. Holding aside the major war category, which I hope is not a meaningful risk even if some days it seems more plausible than I’d like, that leaves us with two categories of events that might blow a hole in your portfolio. Ordinarily, I would consider that of the two remaining, the economic crisis is the worse by a significant margin. It is only in a depression-like scenario that material numbers of companies go bankrupt and investors suffer meaningful permanent dilution.
The funny thing is that, from here, dilution may not be the worst thing that can happen to investor brokerage statements. Exhibit 7 shows the 10-year deviations from trend dividends for each year starting in 1900 for the S&P 500. Turns out that the worst thing that ever happened on that measure wasn’t actually the Great Depression, but rather World War I and the depression that followed it.
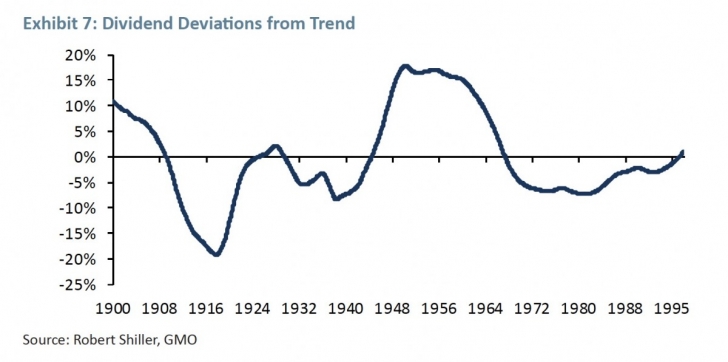
Even in the worst event, the loss was about 20% of expected dividends over a decade, which isn’t truly catastrophic. It means significantly less than a 20% loss of economic value – maybe 5% to 10% depending on whether you assume there will be a “catch-up” in dividends at some point in the future.
And the positive side of an economic crisis occurring is that we know damn well what central bankers would do in the event. A modern central bank would immediately bring interest rates to zero or below and hold them there for not merely the duration of the crisis but for as long after as circumstances will allow. So let’s imagine the results of an economic crisis. Imagine first that the economic value of the stock market falls by a full 15% – worse than anything we have seen in the US since stock market records began. That knocks the S&P 500 down from 2600 to 2080 before we account for any change in valuation.
Let us assume further that the crisis disabuses investors of any notion that stocks aren’t risky, and therefore investors demand a full 4% equity risk premium over cash to compensate. On the flip side, what would investors expect cash rates to be in the future? Given that in the 18 years since the end of 1999, T-Bills have averaged a real yield of -0.6%, let’s be conservative and say that long-term cash estimates would be 0% real. That means the required return to stocks would be 4% real and the Shiller P/E of the market that would be consistent with that is around 23.
If we combine the 15% loss of value with the required fall in valuations, we are talking about a market drop to a little over 1600 – although I could argue that it might be somewhat worse than that since the last 10 years really do look like they have been extraordinary from a profits/GDP perspective. Let’s say profits really do go back to their old relationship with GDP. This would knock another 15% off of the market, dropping us to 1360. A very nasty shock to investors, to be sure. On the other hand, this is exactly the kind of scenario that bonds are in your portfolio for.
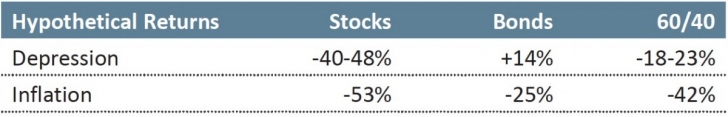
If, at the same time this happened, the yield on US bonds went to the yields we see today in the eurozone, a bond portfolio with equivalent duration to the US Aggregate5 would experience a windfall of 14%. An old fashioned 60% stock/40% bond portfolio would lose somewhere between 18% to 23% from the event.
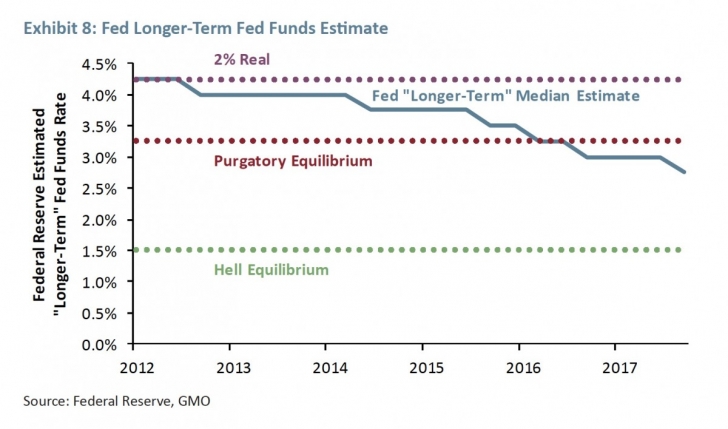
Let’s imagine instead that rather than a depression, we found ourselves with a moderate inflation problem with expected real cash rates moving to 2% real – a level exactly in line with the Fed’s “Dot Plot” as recently as 2012, as we can see in Exhibit 8.
5 While I still think of this as the “Lehman” Aggregate, apparently the full name now is the Bloomberg/Barclays US Aggregate Bond Index. I have to admit the name has a bit of alliteration on its side, but I find it far from mellifluous.
There are three horizontal lines on this chart. The top one is the 2% real line of the “inflation is an issue” scenario, the middle line is our standard “Purgatory” assumption, and the lowest is the “Hell” assumption. As of 2012, the Fed’s official long-term view was in keeping with the 2% real cash, although today they are between Purgatory and Hell in their assumption.
Let’s imagine we get to 2% real cash rates as equilibrium. From a corporate cash flow perspective, the real cost of debt will be significantly higher, so earnings accruing to shareholders will likely drop. Given the pretty high leverage of the market and very low current interest costs, let’s conservatively imagine that sustainable earnings for shareholders fall by 7.5%. This takes the market from 2600 to 2340. The much bigger issue is that if the stock market has to deliver 6% real to give an adequate risk premium over the healthy cash rate, the fair Shiller P/E is probably about 16. The combination of falling earnings and valuations takes the market down to about 1200 on the S&P 500.
At the same time, bonds would be taking it on the chin as well. If the yield on the US Aggregate rose to 7%, which was merely its average yield for the decade of the 1990s, a bond portfolio would be expected to lose around 25%. The 60/40 portfolio that lost 18% to 23% in the depression scenario loses 42% in this one. This is far from a worst-case scenario for inflation. If we imagined something that caused inflation expectations to rise to 5% and real rates to rise to 3%, the fall for the 60/40 portfolio goes to 52%.6
As a reminder, these losses are not to the worst trough level for the market, but the fair value that the stock and bond markets should oscillate around.
Could other assets save you?
Unfortunately, it’s not entirely clear what other assets would save your portfolio in this event. Real estate and infrastructure form a big chunk of investors’ “inflation hedging” portfolios, but it’s hard to see how they help a lot here. While real cash flows from the underlying assets would be expected to keep up with inflation, these assets are usually held in a levered form. Rising real rates would hurt cash flows for holders similarly (or worse) to what we modeled for equities. The big driver of the losses in equities was not cash flow problems but falling valuations, and the same logic applies for these assets as well. Natural resources have a possibly better claim as protectors, as they have the potential for an increase in real cash flows. However, this is really only true in a particular kind of inflation – one that is driven by a spike in resource prices that is greater than that of prices in the rest of the economy. Should such a commodity spike happen, commodity futures have the potential for a windfall7 and resource stocks would certainly hold up much better than other equities. But if resource prices were to rise only in line with other prices, that protection would be minimal.
6 And it should go without saying that this is far from the worst outcome one could imagine with regard to inflation. Long-term inflation expectations got to 7% in the 1970s in the US, and real yields peaked far above 3%.
7 As long as the forward curve of commodity prices wasn’t pricing it in. Given the way commodity futures indices have underperformed spot commodities over the last 15 years, that’s a decently big if.
Okay, but can it happen?
The hypothetical inflation case is a scary one, but inflation is far from people’s minds as a big risk. In the past decade we’ve actually seen two different commodity price spikes that didn’t lead to any significant inflation, and the relationship between unemployment and inflation seems to have gone completely flat. Exhibit 9 shows the relationship between wage growth and unemployment in the US for the periods 2000-2008 and 2008-2017.
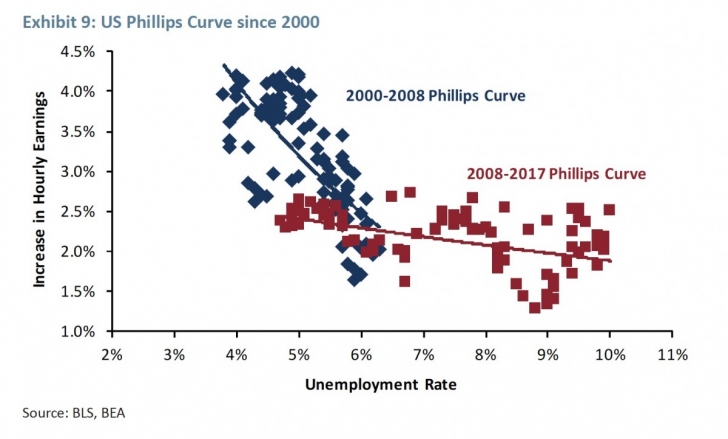
Prior to the financial crisis, the relationship between unemployment and wage growth was what economists expect – when unemployment gets low, wages heat up. Since then, the relationship has been much more muted, with 80% less slope than the older relationship. So perhaps something has really changed. On the other hand, 2008 wasn’t all that long ago. Maybe the current situation is temporary and we will go back to the old rules. And maybe the Fed will be slow to catch on to the shift and wind up behind the curve, allowing inflation expectations to rise significantly. Is it my base case? No. But it doesn’t seem like an entirely implausible one, either.
So what can we do?
The basic trouble with the rising inflation environment on investor portfolios is that it hits every asset class with significant duration. Stocks, bonds, real estate, private equity, infrastructure, all should take a hit. And there are few, if any, assets that reliably do well in the event of unanticipated inflation. TIPS outperform traditional bonds, but certainly would lose money. Resource stocks should beat traditional stocks by a large margin if there is a meaningful commodity component to the inflation. But as they are also a long-duration asset, whether they would make money in absolute terms is less clear.
There is on e security that is more or less guaranteed to pay off in the event of unanticipated inflation – an inflation swap. If inflation is higher than expected, such a contract will give a windfall gain, exactly what we’d want to cushion a portfolio. The trouble with buying an inflation swap is that if we imagine a scenario in which inflation surprises significantly to the downside, it is the depression scenario – the other way portfolios get hit pretty hard. So we can reliably protect against the inflation scenario at the cost of almost certainly worsening the depression scenario. That might be the right trade, but it is hardly a lay-up.
In our benchmark-free portfolios, our primary defense against the inflation threat has been shortening the duration of our assets. This is straightforward in fixed income. We own some duration in the form of TIPS, which are at least less acutely vulnerable to inflation than traditional bonds, but most of our fixed income portfolio has a duration of two years or less. In the risky part of the portfolio, we have moved significant amounts of money to liquid alternatives, and I have written at length how we believe liquid alts are a significantly shorter-duration way of taking depression risk than equities.
There is a final, somewhat speculative piece of comfort I take in our equity portfolios. Significant inflation would certainly come as a nasty shock to equity investors in general. But if there is one group of equities that deals with inflation on a pretty much continuous basis, it is emerging equities. Emerging markets usually have a decently high beta in down markets. But it is not so far-fetched to imagine that if the catalyst for the fall were rising inflation, the stock markets where inflation was never absent in the first place might be better able to shrug it off. To be clear, our fondness for emerging equities today is driven overwhelmingly by their cheaper valuations, not a speculative belief in their resilience against an event that has not occurred since emerging became an institutionally buyable asset class. But if worse did come to worst and inflation flared up, owning a good chunk of the only equities that remember what inflation is like seems like a decent idea.
Copyright © GMO LLC