by David Blitzer, Managing Director and Chairman of the Index Committee, S&P Dow Jones Indices
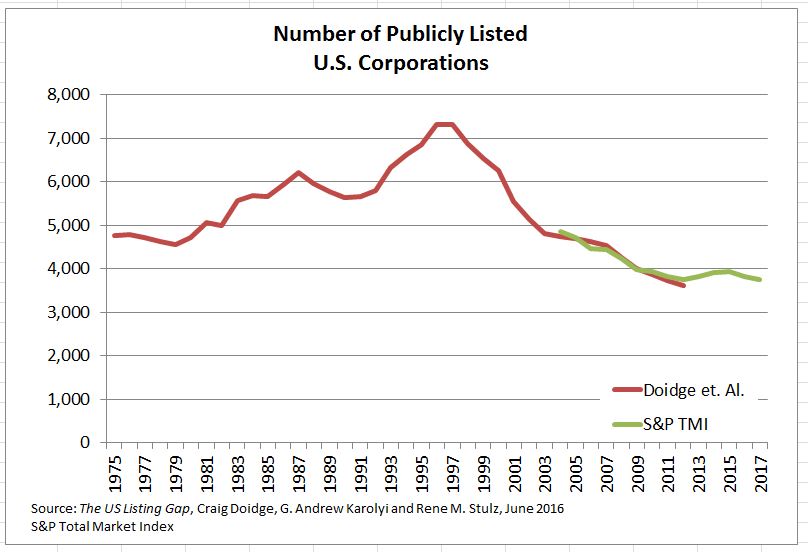
The number of stocks listed in the US is falling. Currently there are 3,758 listed stocks, ten years ago there were 4,500 and 20 years ago the number topped 7,400. The total value of the market, as measured by the total market capitalization of the S&P Total Market Index, continues to rise. As of yesterday it was $27.3 trillion, up 20% from a year earlier.
However, this gain was largely due to increasing stock prices, not to new capital coming into the market. Not only are there fewer stocks today than earlier, but capital is flowing out of the market. Two leading reasons for the declining number of stocks are fewer IPOs and more mergers. The explanation for the capital outflows are dividends and buybacks, plus acquisitions by foreign or private companies.

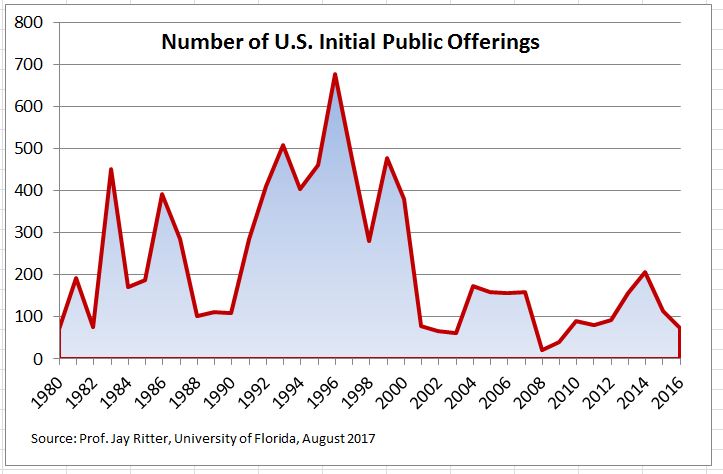
The annual pace of initial public offerings (IPOs) collapsed after the tech bust in 2000. In the 1990s, IPOs averaged 400 per year; dropped to about 150 in 2000-2006 and then to 100 per year in 2007-2016. In the last four years since the financial crisis the number showed little improvement, only reaching 140 per year. Analysts suggest various reasons for the drop: regulatory costs of being a public company, fear of activist investors and, most of all, the ease of raising capital in the private markets.
The stars in the private markets are the unicorns – private companies with valuations over a billion dollars. Uber, worth about $60 billion is the most famous unicorn, but certainly not the only one. Other household names include AirBnb, Dropbox and WeWork. There are over 100 unicorns in the US and a roughly equal number outside the US. China is second in terms of both the number and the total value. When a company can reach a valuation of a billion, or ten billion or possibly $60 billion in the private market, it is no surprise that IPOs are slowing down.
While some private companies do eventually become public they are older and larger than they were in the 1990s, and may have a better chance of surviving. Moreover, not all the unicorns become IPOs and some that do vanish shortly thereafter. Since 2009, 110 companies left the unicorns list – 61 IPO-ed including Facebook, Tesla and Pandora but 49 were acquired including BATS, LinkedIn and Zappos. Some promising companies like WhatsApp are acquired before they have a chance to go public.

Mergers and acquisitions are another drain on the number of public companies. Bloomberg data shows an average of 7,700 transactions annually since 2005 totaling about $980 billion each year. Similar data from the Institute for Mergers, Acquisitions and Alliances (IMAA) shows that mergers climbed steadily from 1985 to the mid-1990s when the number of listed stocks peaked. Since there the pace has varied somewhat, but the annual number of mergers never dropped below what was seen in 1995. Anti-trust efforts faded as mergers rose.
While the number of companies was dropping, capital was also leaving the markets. The drain was not due to mergers which only drain capital when the acquirer is a foreign company or private equity. Rather, stock buybacks and dividends together drain about 5% a year out of the US markets. The Federal Reserve’s Flow of Funds data show that from 2012 to 2016, there was negative net issuance of corporate equity of $2.2 trillion. If one examines the S&P Total Market Index divisor it fell 12% from 2005 to 2016 indicating that capital flowed out of the index and the market over that time period.
Copyright © S&P Dow Jones Indices


