For this week’s edition of the Equity Leaders Weekly, we are going to look look at Small Cap equities on both sides of the border. Both markets consist of similar industry or sector classifications, however the major differences lie in the percentage weights of these industries. For Canada we will analyze the iShares S&P/TSX Small Cap ETF (XCS.TO) for the US we will analyze the iShares S&P Small Cap ETF (IJR).
iShares S&P/TSX Small Cap Index ETF (XCS.TO)
The iShares S&P/TSX Small Cap Index is considered the most ideal benchmark for investors who have small cap exposure to the Canadian small cap equity market. This ETF has a large exposure to Materials and Energy sectors which coincides the overall makeup of the Canadian Equity space. In fact, XCS.TO has a 26% weighting towards Materials and a 22% weighing towards energy. These two sectors alone comprise almost half of the fund.
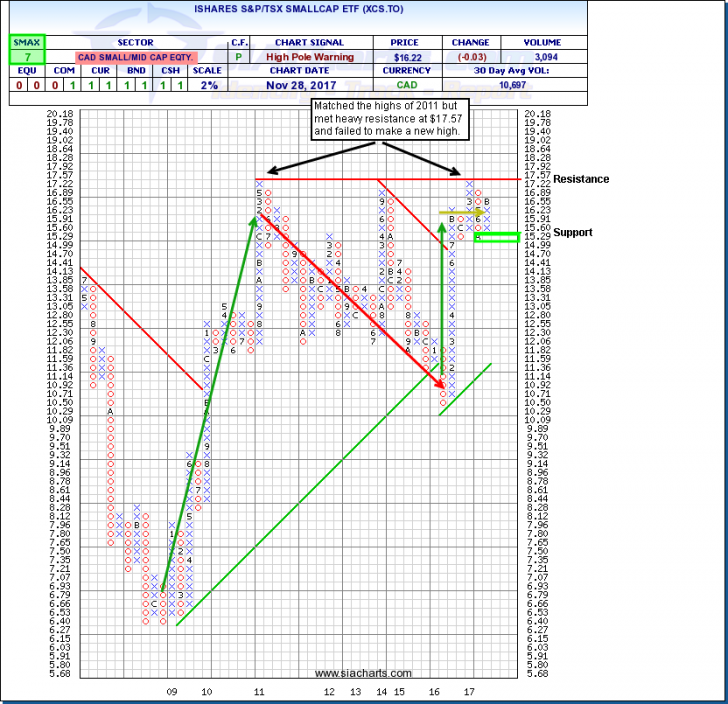
In looking at the attached chart, we can see the ETF has rallied nicely from the spring of 2009 to the spring of 2011. Then from May of 2011 to February of 2016 we saw the trend reverse to the downside in the Cdn Small Cap space. There was a very sharp rally which took place from February 2016 to March 2017 when we matched the previous high established in the spring of 2011. Earlier this year, the ETF was unable to break above the 2011 high as it again met some resistance at the $17.57 level. It has now been range bound since late 2016. The large cap Canadian market recently established a new high when the TSX surpassed the 16,000 mark due the strength of the financials and few other select names such as Restaurant Brands (QSR.TO) and Dollarama (DOL.TO).
It will be interesting to see what direction the Small Cap Index will in the near future. Whether it can establish new highs or if a new downtrend will materialize will be an important inflection point to watch. Needless to say, with such a heavy weighing toward materials and energy, these two sectors would need to strengthen further if the Canadian Small Cap space is to continue on its uptrend. Support for XCS.TO can be found at $14.99 to $15.29 area. Heavy resistance will be met at the $17.57 level. With an SMAX of 7 out of 10, XCS.TO is showing near term strength against 3 out of 5 asset classes.

iShares S&P Small Cap ETF (IJR)
It has been a different story within the small cap world south of the border. In looking at the iShares S&P Small Cap ETF (IJR), which seeks to track the investment results of an index composed of small-capitalization U.S. equities, we see a much different chart pattern. This ETF has a portfolio makeup drastically different to XCS.TO. Within IJR, the heaviest weightings are towards Industrials at 19%, Financials at around 17% and Consumer Discretionary and Information Technology both at about 15% of the fund. Materials and Energy combined only make up about 8.5% of the portfolio weighting.
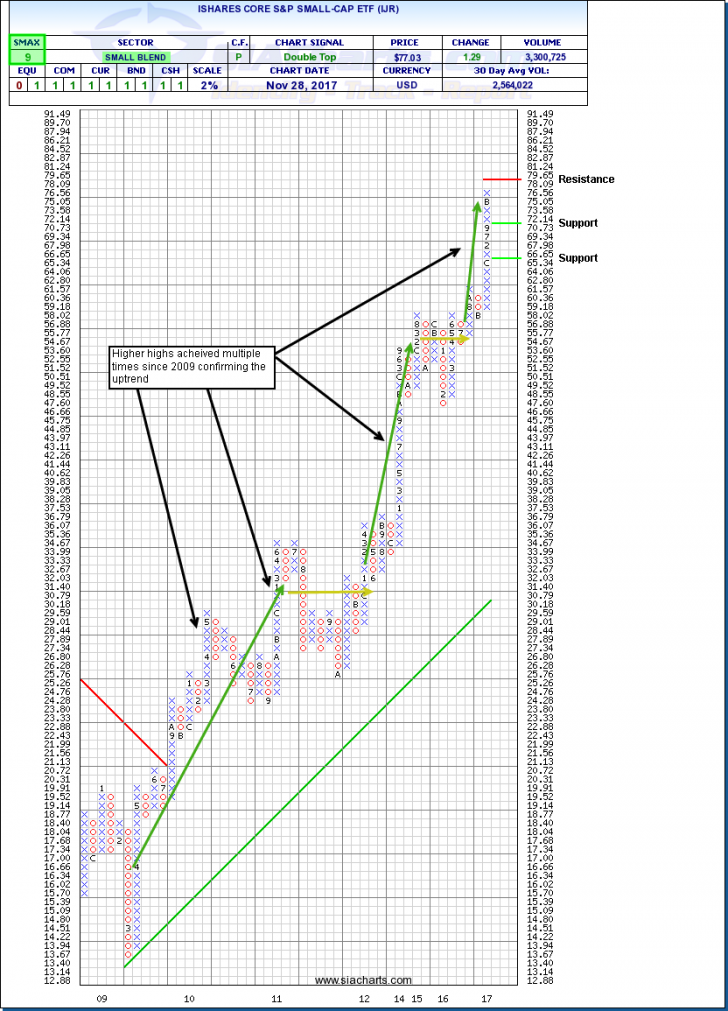
In the attached chart, we see that IJR has been in a steady uptrend from the spring 2009 up until today with the exception of a few sideways consolidations in 2011 and 2014/2015. Also, earlier this year in March, the ETF has broken out to the upside further continuing its uptrend unlike its Canadian small cap counterpart. The next level of resistance is at the $80.00 area while support can be found at $70.73 and, below that, $65.34. With an SMAX of 9 out of 10, IJR is showing near term strength against most asset classes.
Certainly due to the more diversified nature and strength in US equities as per our Asset Class Rankings combined with a smaller reliance on the resource sector has not only helped the overall US equity market (with the S&P 500 continuing to make new all-time highs for quite some time) but it has also carried through to the small cap equity space as well which has not occurred on the northern side of the border, yet.

SIACharts.com specifically represents that it does not give investment advice or advocate the purchase or sale of any security or investment. None of the information contained in this website or document constitutes an offer to sell or the solicitation of an offer to buy any security or other investment or an offer to provide investment services of any kind. Neither SIACharts.com (FundCharts Inc.) nor its third party content providers shall be liable for any errors, inaccuracies or delays in content, or for any actions taken in reliance thereon.
For a more in-depth analysis on the relative strength of the equity markets, fixed income, commodities, currencies, etc. or for more information on SIACharts.com, you can contact our sales and customer support at 1-877-668-1332 or at siateam@siacharts.com.
Copyright © SIACharts


