


by Ryan Detrick, LPL Research
Historically, December has been a strong month for equities, but will that be the case this year? Here are some stats to be aware of as we head into the home stretch for 2017 (all stats are as of 1950*):
- December has been the strongest month of the year for the S&P 500 Index, posting gains 74.6% of the time with an average return of +1.6%. Both are the best out of the 12 months of the year.

- When the S&P 500 began December above its 200-day moving average (as 2017 likely could), returns have been even better as the index posted gains 76.1% of the time (35 out of 46) with an average monthly return of 2.0%. Conversely, when the index started December beneath its 200-day moving average, it finished the month higher 71.4% of the time (15 out of 21) with an average gain of 0.9%.
- When the S&P 500 was up more than +15% year to date heading into December (as 2017 likely could), the index has closed out the month higher 14 out of 20 times with an average return of +1.7%— again better than the average return.
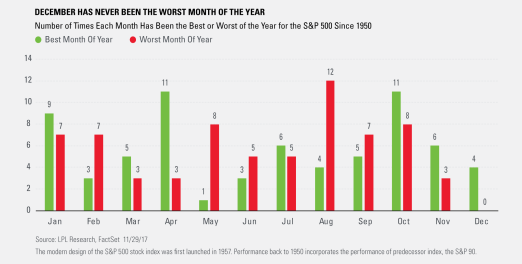
- Incredibly, December has never been the worst month of the year. Per Ryan Detrick, Senior Market Strategist, “While we all know that December is historically a bullish month, what also stands out is that this month has never once been the worst month of the year for the S&P 500. Considering March 2017 is the current worst month of the year, as it closed down 0.04%, this could bode well for the bulls in December.”


*****
IMPORTANT DISCLOSURES
*Please note: The modern design of the S&P 500 stock index was first launched in 1957. Performance back to 1950 incorporates the performance of predecessor index, the S&P 90.
The economic forecasts set forth in the presentation may not develop as predicted.
The Standard & Poor’s 500 Index is a capitalization-weighted index of 500 stocks designed to measure performance of the broad domestic economy through changes in the aggregate market value of 500 stocks representing all major industries.
Investing in stock includes numerous specific risks including: the fluctuation of dividend, loss of principal and potential illiquidity of the investment in a falling market.
Indexes are unmanaged and cannot be invested into directly. Unmanaged index returns do not reflect fees, expenses, or sales charges. Index performance is not indicative of the performance of any investment. Past performance is no guarantee of future results.
All information is believed to be from reliable sources; however LPL Financial Makes no representation as to its completeness or accuracy.
The opinions voiced in this material are for general information only and are not intended to provide or be construed as providing specific investment advice or recommendations for any individual security.
This research material has been prepared by LPL Financial LLC.
To the extent you are receiving investment advice from a separately registered independent investment advisor, please note that LPL Financial LLC is not an affiliate of and makes no representation with respect to such entity.
Not FDIC/NCUA Insured | Not Bank/Credit Union Guaranteed | May Lose Value | Not Guaranteed by any Government Agency | Not a Bank/Credit Union Deposit
Securities and Advisory services offered through LPL Financial LLC, a Registered Investment Advisor
Member FINRA/SIPC
Tracking #1-672978 (Exp. 11/18)
Copyright © LPL Research