by Craig Basinger, Chris Kerlow, Derek Benedet, Shane Obata, Connected Wealth, RichardsonGMP
November 6, 2017
The economy is made up of many moving parts including consumer spending, government spending, net exports and investments. For the U.S., and Canada for that matter, consumer spending is the biggest piece of the equation. General rule of thumb is consumer spending makes up about 70% of the U.S. economy.
Meanwhile the S&P 500 Index carries less than a 20% weighting in the two sectors most sensitive to consumer spending, namely Consumer Discretionary and Consumer Staples. Investment, which is a much smaller contributor to GDP, has a much bigger impact on the equity markets. This is one of the key reasons that economic growth and equity market earnings can, and often do, diverge. The markets are much more sensitive to investments and this has a higher connection to market earnings.
Investment, which we will narrow down to capital expenditure or CAPEX, has been missing for much of this economic expansion. Following the last recession, there was a lack of synchronized global economic growth as many economies experienced double dip recessions (Japan), currency crisis (Eurozone) or other interruptions to growth. This caused the global economy, as a whole, to grow much more gradually compared to past cycles, and thus end demand also grew at a tepid pace.
When it comes to CAPEX you really need to see rising end demand to give enough confidence to company management to reinvest in the business to raise production capacity. If you build too early, before demand is there, it is a quick path to bankruptcy or trouble. Since demand was lacking, corporations opted to return excess cash flow to shareholders via higher dividends and share buybacks.

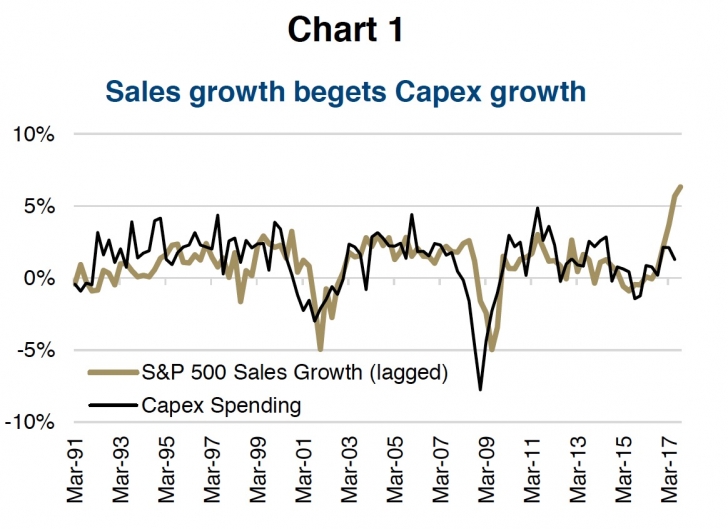
But the situation has changed. For the past four or five quarters it seems all the major economies are expanding at a reasonable pace. With better global growth comes rising end demand. While there are a few ways to measure this, it is evident at the company level via higher revenues or sales. Chart 1 shows S&P 500 aggregate sales, lagged, and CAPEX.
Essentially, once the sales begin to rise, CAPEX is soon to follow. And sales have been rising nicely. This is resulting in rising end demand and emboldening Chief Financial Officers to loosen those purse strings and invest more in the business to increase capacity or sales.

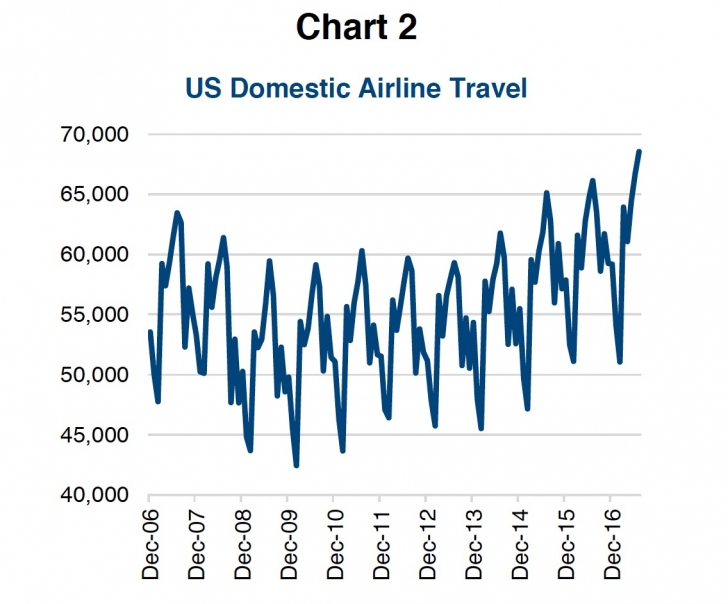
Reinvesting in the business is evident in a number of areas including air travel. It seems everyone is travelling more for work, based on personal experience of airlines, full flights and airline stock performance. The numbers support this as well with a record amount of passengers flying (chart 2, previous page).
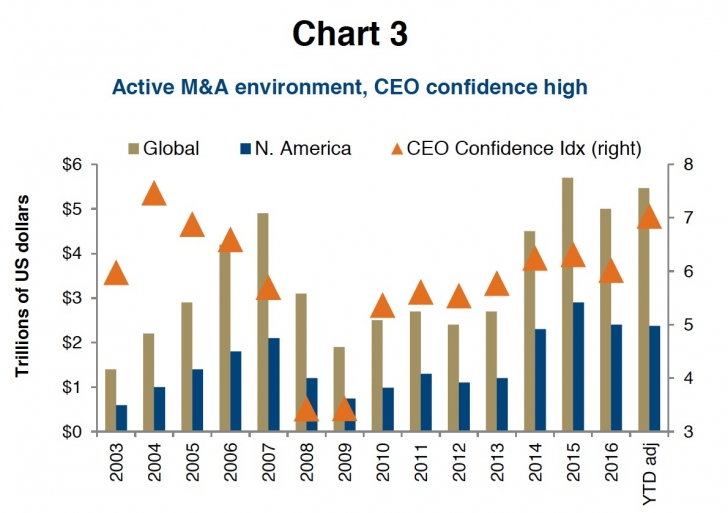
Greater confidence among company management is also evident in a very healthy mergers and acquisitions environment. Globally, there have been $4.6 trillion worth of deals announced or completed. That is up 14% over last year’s pace and a little more activity could push 2017 to be a record year.

Chart 3 is M&A activity with 2017 adjusted to a full year equivalent if the current pace continues. Often there are more deals late in the year, so a record could be in the cards.
Market is Rewarding CAPEX Spenders
What’s interesting is that since early 2016 investors have been rewarding those companies which have been investing in CAPEX. At different points in the market cycle, investors tend to favour companies that are more heavily CAPEX focused while at other times they favour companies that return excess cash to shareholders via dividends or share buybacks.

Chart 4 shows the relative performance of companies that choose CAPEX vs. those that choose to return more of their cash to shareholders. From 2010 through mid-2016, investors rewarded those companies that boosted dividends or did share buybacks (blue ratio line falling).
Since then, investors now have growth on their mind and are rewarding companies focusing on organic growth. Companies that can continue to grow organically can grow into their likely already stretched valuations. While buybacks inflate EPS on the surface, they are not a long term plan for business success.
Investment Implications
This is a normal occurrence late in the market cycle and is also very positive for corporate earnings. We continue to believe that this CAPEX cycle has room to run given the long period of underinvestment.
Sectors that benefit tend to be more in the Industrials and Information Technology. Although there are CAPEX sensitive companies in many sectors, it really comes down to a company-to-company analysis.
*****
Charts are sourced to Bloomberg unless otherwise noted. This material is provided for general information and is not to be construed as an offer or solicitation for the sale or purchase of securities mentioned herein. Past performance may not be repeated. Every effort has been made to compile this material from reliable sources however no warranty can be made as to its accuracy or completeness. Before acting on any of the above, please seek individual financial advice based on your personal circumstances. However, neither the author nor Richardson GMP Limited makes any representation or warranty, expressed or implied, in respect thereof, or takes any responsibility for any errors or omissions which may be contained herein or accepts any liability whatsoever for any loss arising from any use or reliance on this report or its contents. Richardson GMP Limited is a member of Canadian Investor Protection Fund. Richardson is a trade-mark of James Richardson & Sons, Limited. GMP is a registered trade-mark of GMP Securities L.P. Both used under license by Richardson GMP Limited.
Copyright © Connected Wealth, RichardsonGMP


