by Rob Arnott Vitali Kalesnik Engin Kose Lillian Wu, Research Affiliates
Key Points
- Simulated portfolios based on momentum add remarkable value, in most time periods and in most asset classes, all over the world; however, live results for mutual funds that take on a momentum factor loading are surprisingly weak.
- A primary contributor to the performance gap between the standard momentum factor’s live and theoretical results is the price impact of trading costs associated with the strategy’s high turnover.
- In addition to thoughtful implementation, relying on a strong sell discipline and avoiding stocks with stale momentum can help investors capture more of the benefits of the momentum factor.
There’s many a slip twixt cup and lip.— Old English proverb
On paper, momentum is one of the most compelling factors: simulated portfolios based on momentum add remarkable value, in most time periods and in most asset classes, all over the world. So, our title may seem unduly provocative. However, live results for mutual funds that take on a momentum factor loading are surprisingly weak.1 No US-benchmarked mutual fund with “momentum” in its name has cumulatively outperformed its benchmark since inception, net of fees and expenses. Worse, because the standard momentum factor gave up so much ground in the last momentum crash of 2008–2009, it remains underwater in the United States, not only compared to its 2007 peak, but even relative to its 1999 performance peak. This means 18 years with no alpha, before subtracting trading costs and fees!2
To be sure, most advocates of momentum investing will disavow the standard model, and will claim they use proprietary momentum strategies with better simulated, and perhaps better live, performance. A handful (especially in the hedge fund community) may be able to point to respectable fund performance, net of trading costs and fees. But a careful review of the competitive landscape reveals that most claims of the merits of momentum investing are not supported by data, particularly not live mutual fund results, net of trading costs and fees.3
The three traps for momentum investing are 1) high turnover, in crowded trades, which leads to high trading costs; 2) a careless sell discipline, because momentum’s profits accrue for months, not years, and then reverse course; and 3) repeat winners (and losers), which have been soaring (or tumbling) for so very long they enjoy little or no momentum follow-through. Each of these traps can be avoided. By evading these traps, we can narrow the gap between paper and live results. Yes, momentum can probably be saved, even net of fees and trading costs.
This is the fourth and final article in the Alice in Factorland series.4
Momentum is the tendency for rising stock prices to continue rising and for falling stock prices to continue falling. Why should stocks behave this way? Human nature conditions us to extrapolate our recent past experience: we want more of anything that has given us great joy and profit, and we want less of whatever has given us pain and losses. For this simple reason, momentum investing is popular. The mere act of buying recent winners and selling recent losers is both comfortable and enticing, and many investors act accordingly. Thus, human behavior may play a large role in fueling price momentum and creating a self-fulfilling prophecy. This may be the reason the momentum factor has enjoyed persistent success for so many years, in so many geographic regions. Momentum’s steam is able to power on, however, only until valuations are stretched so far that relative valuation overcomes the forces of momentum.
Momentum: Toward a Better Understanding
Whereas investors have pursued momentum investing for centuries, the “science” of understanding momentum is rather new, dating back only about a quarter-century.5 Our understanding has been improved through the work of many researchers, in multiple ways, ranging from correlations between past and subsequent returns to long–short factor portfolios.6
The most convincing explanations for momentum lie in the behavioral realm.7 Three articles are frequently cited as offering the best explanation of the momentum effect. The three underlying theories do not contradict each other and each is likely to be partially responsible for the momentum effect. The first article, Barberis, Shleifer, and Vishny (1998), suggests that when earnings surprises reach the market, investors do not pay them enough attention, and the stock price initially underreacts to the news.8 When the initial news is followed by confirming news, the stock price adjusts in the same direction (momentum), often to the point of over-extrapolation to where the stock price is poised for mean reversion.
Daniel, Hirshleifer, and Subrahmanyam (1998) propose a second explanation, arguing that investors overestimate precision of their private information and underestimate precision of public information as a result of biased self-attribution and overconfidence.9 Overconfidence encourages investors to overestimate the accuracy of their insights or private information, which causes them to trade more aggressively. In the case of biased self-attribution—when success is attributed to superior skill, but failures to bad luck—investors tend to pay attention to confirmatory signals and ignore conflicting ones, which again inspires more aggressive trading. Both behaviors lead to initial momentum and subsequent mean reversion in prices.
The third explanation, a model proposed by Hong and Stein (1999), observes that information is not evenly available to all market participants. The model describes two groups of traders: “news watchers,” who have better access to private information about specific stocks, but are not well versed in market dynamics, so are not able to extract information from prices; and “momentum traders,” who do not have private information, but are well aware of market dynamics. The gradual release of private information leads to an initial underreaction from the news watchers, followed by an overreaction when the momentum traders try to profit by trend chasing, which in turn is followed by price reversion to the mean.10
Momentum in stocks is perhaps one of the best-performing signals on paper: it has a better risk–return tradeoff than most known equity market factors. A momentum factor pairs a long portfolio of stocks whose prices have recently been soaring relative to the market, with a short portfolio of stocks whose prices have been sharply underperforming the market.11 Our research, discussed in this article, considers three types of momentum: 1) standard momentum, which we define as the trailing 12-month return, excluding the most recent month; 2) fresh momentum, capturing stocks in the early part of their momentum trajectory (which we define as standard momentum conditioned on the opposite prior-year relative return); and 3) stale momentum, capturing stocks in the later part of their momentum trajectory (which we define as standard momentum conditioned on the same direction of the prior-year relative return).
In Figure 1, we compare the cumulative relative performance of the long portfolio (winners) versus the short portfolio (losers) (i.e., the standard momentum factor), on a log scale, for five geographic regions, and globally, since 1990. Momentum was first documented by Jegadeesh and Titman in 1993 and, anecdotally, started becoming more popular as a quantitative investment strategy after about 1997. Before that time, although performance-chasing strategies were commonplace, and momentum was an element of many investment managers’ thinking, formal momentum strategies existed mostly as just a backtest.
Momentum appears to be successful, everywhere except Japan. A closer look, however, reveals that the cumulative return for the standard momentum factor in the United States and Japan is no better now than in 1999, and for global markets remains below its 2007 peak. Two momentum crashes, in 2002 and 2009, took their toll on momentum factor performance in the United States by 28% and 54%, respectively, and the factor has not yet recovered. A momentum strategy is very vulnerable to crashes that tend to occur when the momentum trade is relatively expensive and in periods of heightened volatility. Momentum performance has also shown dismayingly high global correlation—especially during the crashes—since about 1999. All six regions show a momentum crash at the end of the tech bubble, at the end of the 2000–2002 bear market, and a big crash in 2009. There was nowhere to hide.


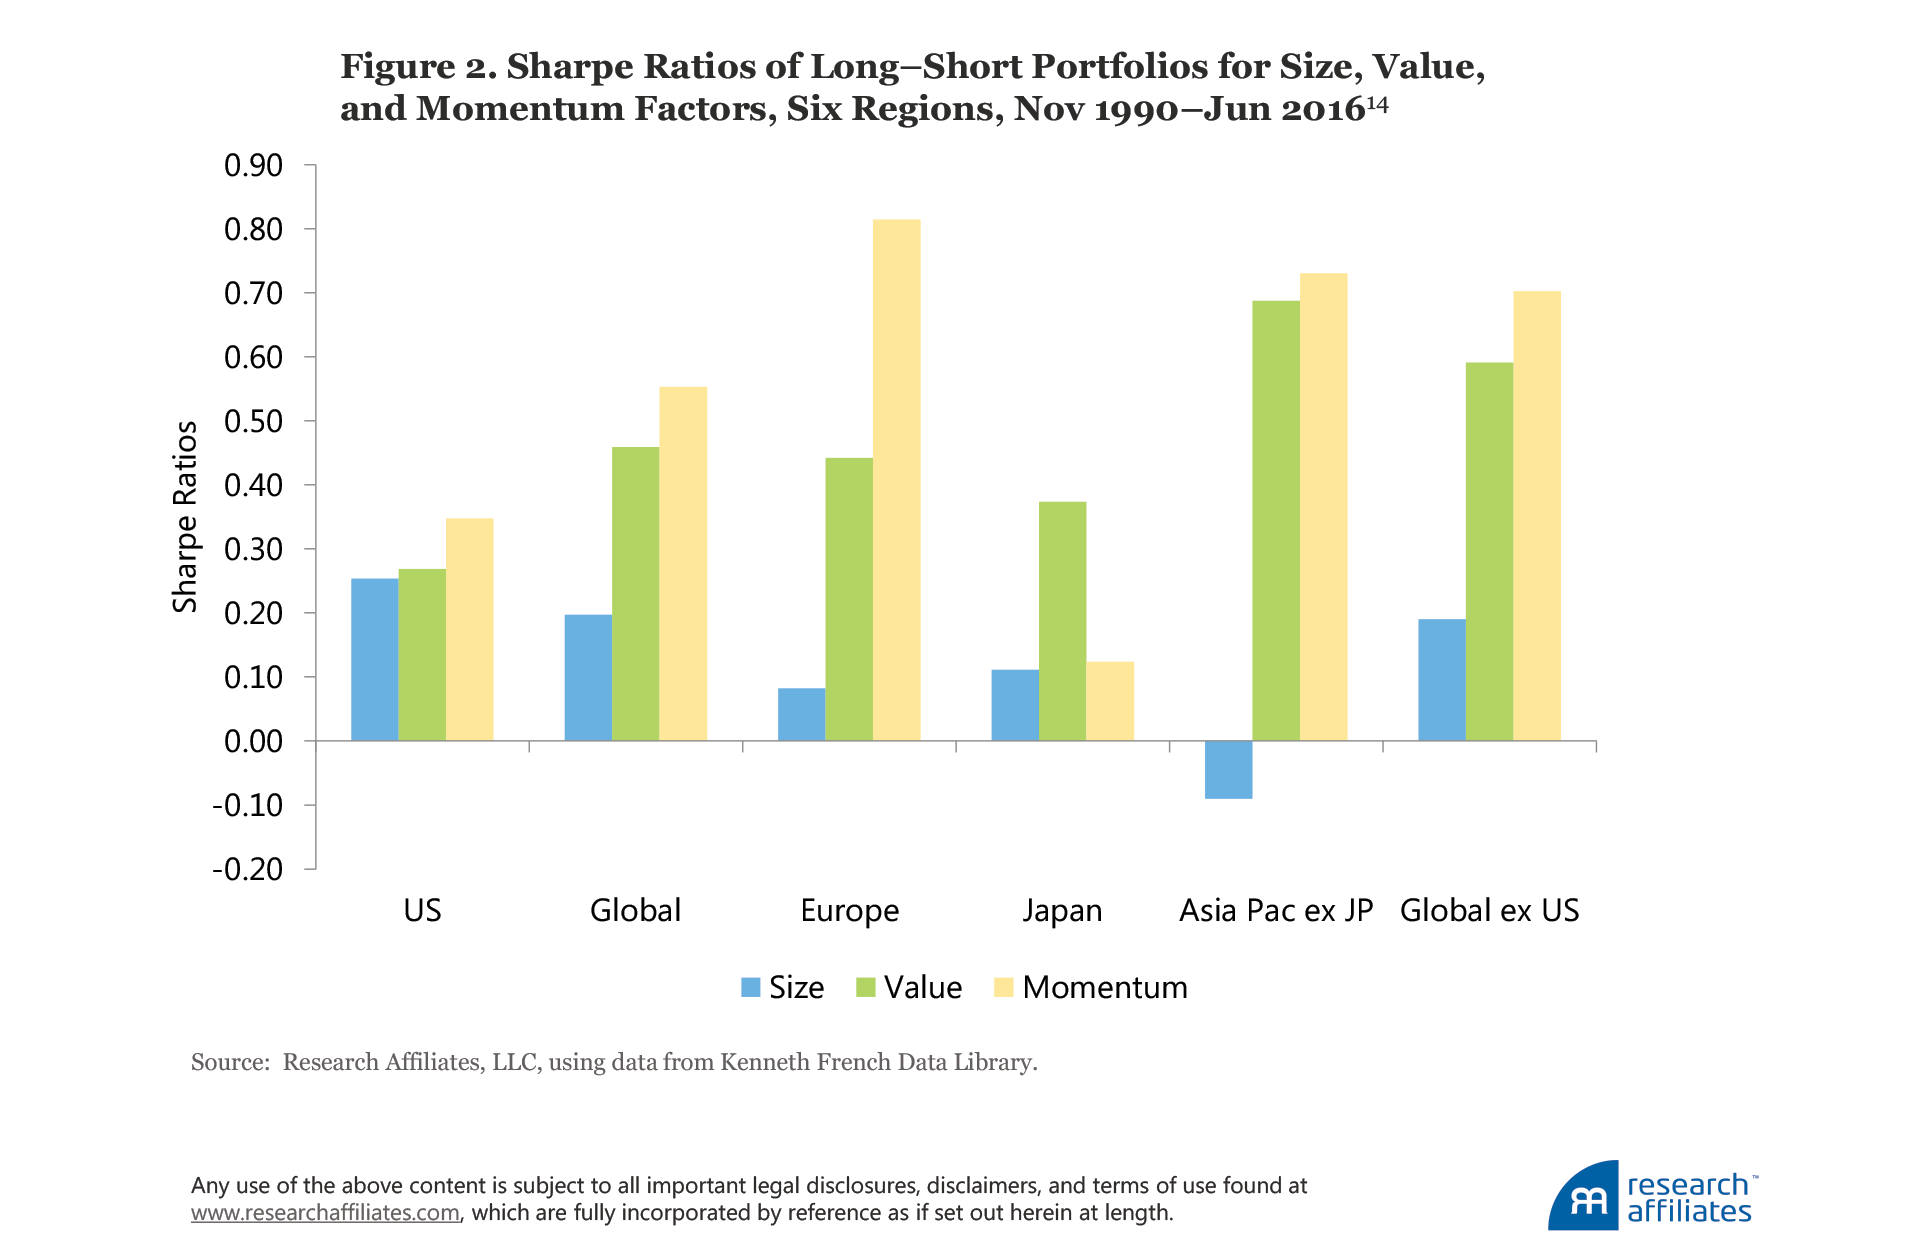
Figure 2 compares, for the same six geographic regions, the Sharpe ratios of the relative performance of the long versus short portfolios for momentum (winners minus losers, or WML) and the original Fama–French factors, size (small cap minus big cap, or SMB) and value (high book-to-price ratio minus low, or HML). Momentum dominates everywhere except Japan.12 Since first documented in US stocks, the momentum effect has also been documented in many other asset classes.13 Again, on paper, momentum looks fantastic! Sadly, live results in the real world hint at trouble for momentum investors, net of trading costs.
In the first article of the Alice in Factorland series, “The Incredible Shrinking Factor Return” (Arnott, Kalesnik, and Wu, 2017), we show that investors in mutual funds capture only fractions of the theoretical returns for some of the most popular long–short factors. By comparing fund performance between funds with high and low factor loadings, we demonstrate that the return from a mutual fund’s exposure to a factor is often significantly lower, per unit of factor loading, than the return indicated by the theoretical factor paper portfolio. Notably, the market and value factor premiums earned by mutual funds since 1990 are about half the indicated theoretical return, and shockingly, the momentum factor premium essentially disappears.
On average, mutual fund managers with high momentum exposure do not appear to derive any benefit relative to managers with low momentum exposure, even during a quarter-century when high-momentum stocks beat low-momentum stocks by around 6% a year. This lack of benefit from momentum breaks neatly into two periods: a large benefit was earned in the 1990s, and nearly all reversed in the years following. Perhaps some individual momentum strategies might have bucked this pattern by providing substantial, reliable alpha.15 An exhaustive exploration of the many flavors of momentum is difficult, and far beyond the scope of our research. In any event, were these new momentum strategies developed in the 1990s? Did these momentum variants work on live assets, or only on paper, with the blessings of hindsight?
In this article we examine the gap between theoretical and live portfolio performance in detail. Let’s begin by digging into the problems of momentum in live portfolios, then explore ways to potentially fix these problems.
The Momentum Gap: Live versus Paper Performance
The gap between paper portfolios and live results is very real. In our first test, we select mutual funds using the Morningstar database of mutual fund performance that have specific keywords in their names. We combine funds sharing a specific keyword into one basket and compute the performance of these baskets of funds (a description of our data and method are in the appendix). We limit this survey to US-benchmarked funds with at least one year of live history, using whichever of three share classes (institutional, A, or no-load) has the longest history.
We show in Table 1, Panel A, the performance characteristics of these funds, for an array of keyword searches in the fund names. We compute two measures of value-add relative to the market: 1) equally weighted by sample, for which we equally weight the fund-month observations (“first method”); and 2) equally weighted by months, for which we combine funds available at a given month into an equally weighted portfolio of those funds and compute the value-add of the portfolio (“second method”). The first approach gives 10 times as much weight to months with 10 live funds as to months with 1 fund; the second gives equal weight to all months with at least 1 fund that meets the keyword search. We display the fund category results in ascending order of their value-add relative to the capitalization-weighted market, based on the first method, which is equally weighted by sample.
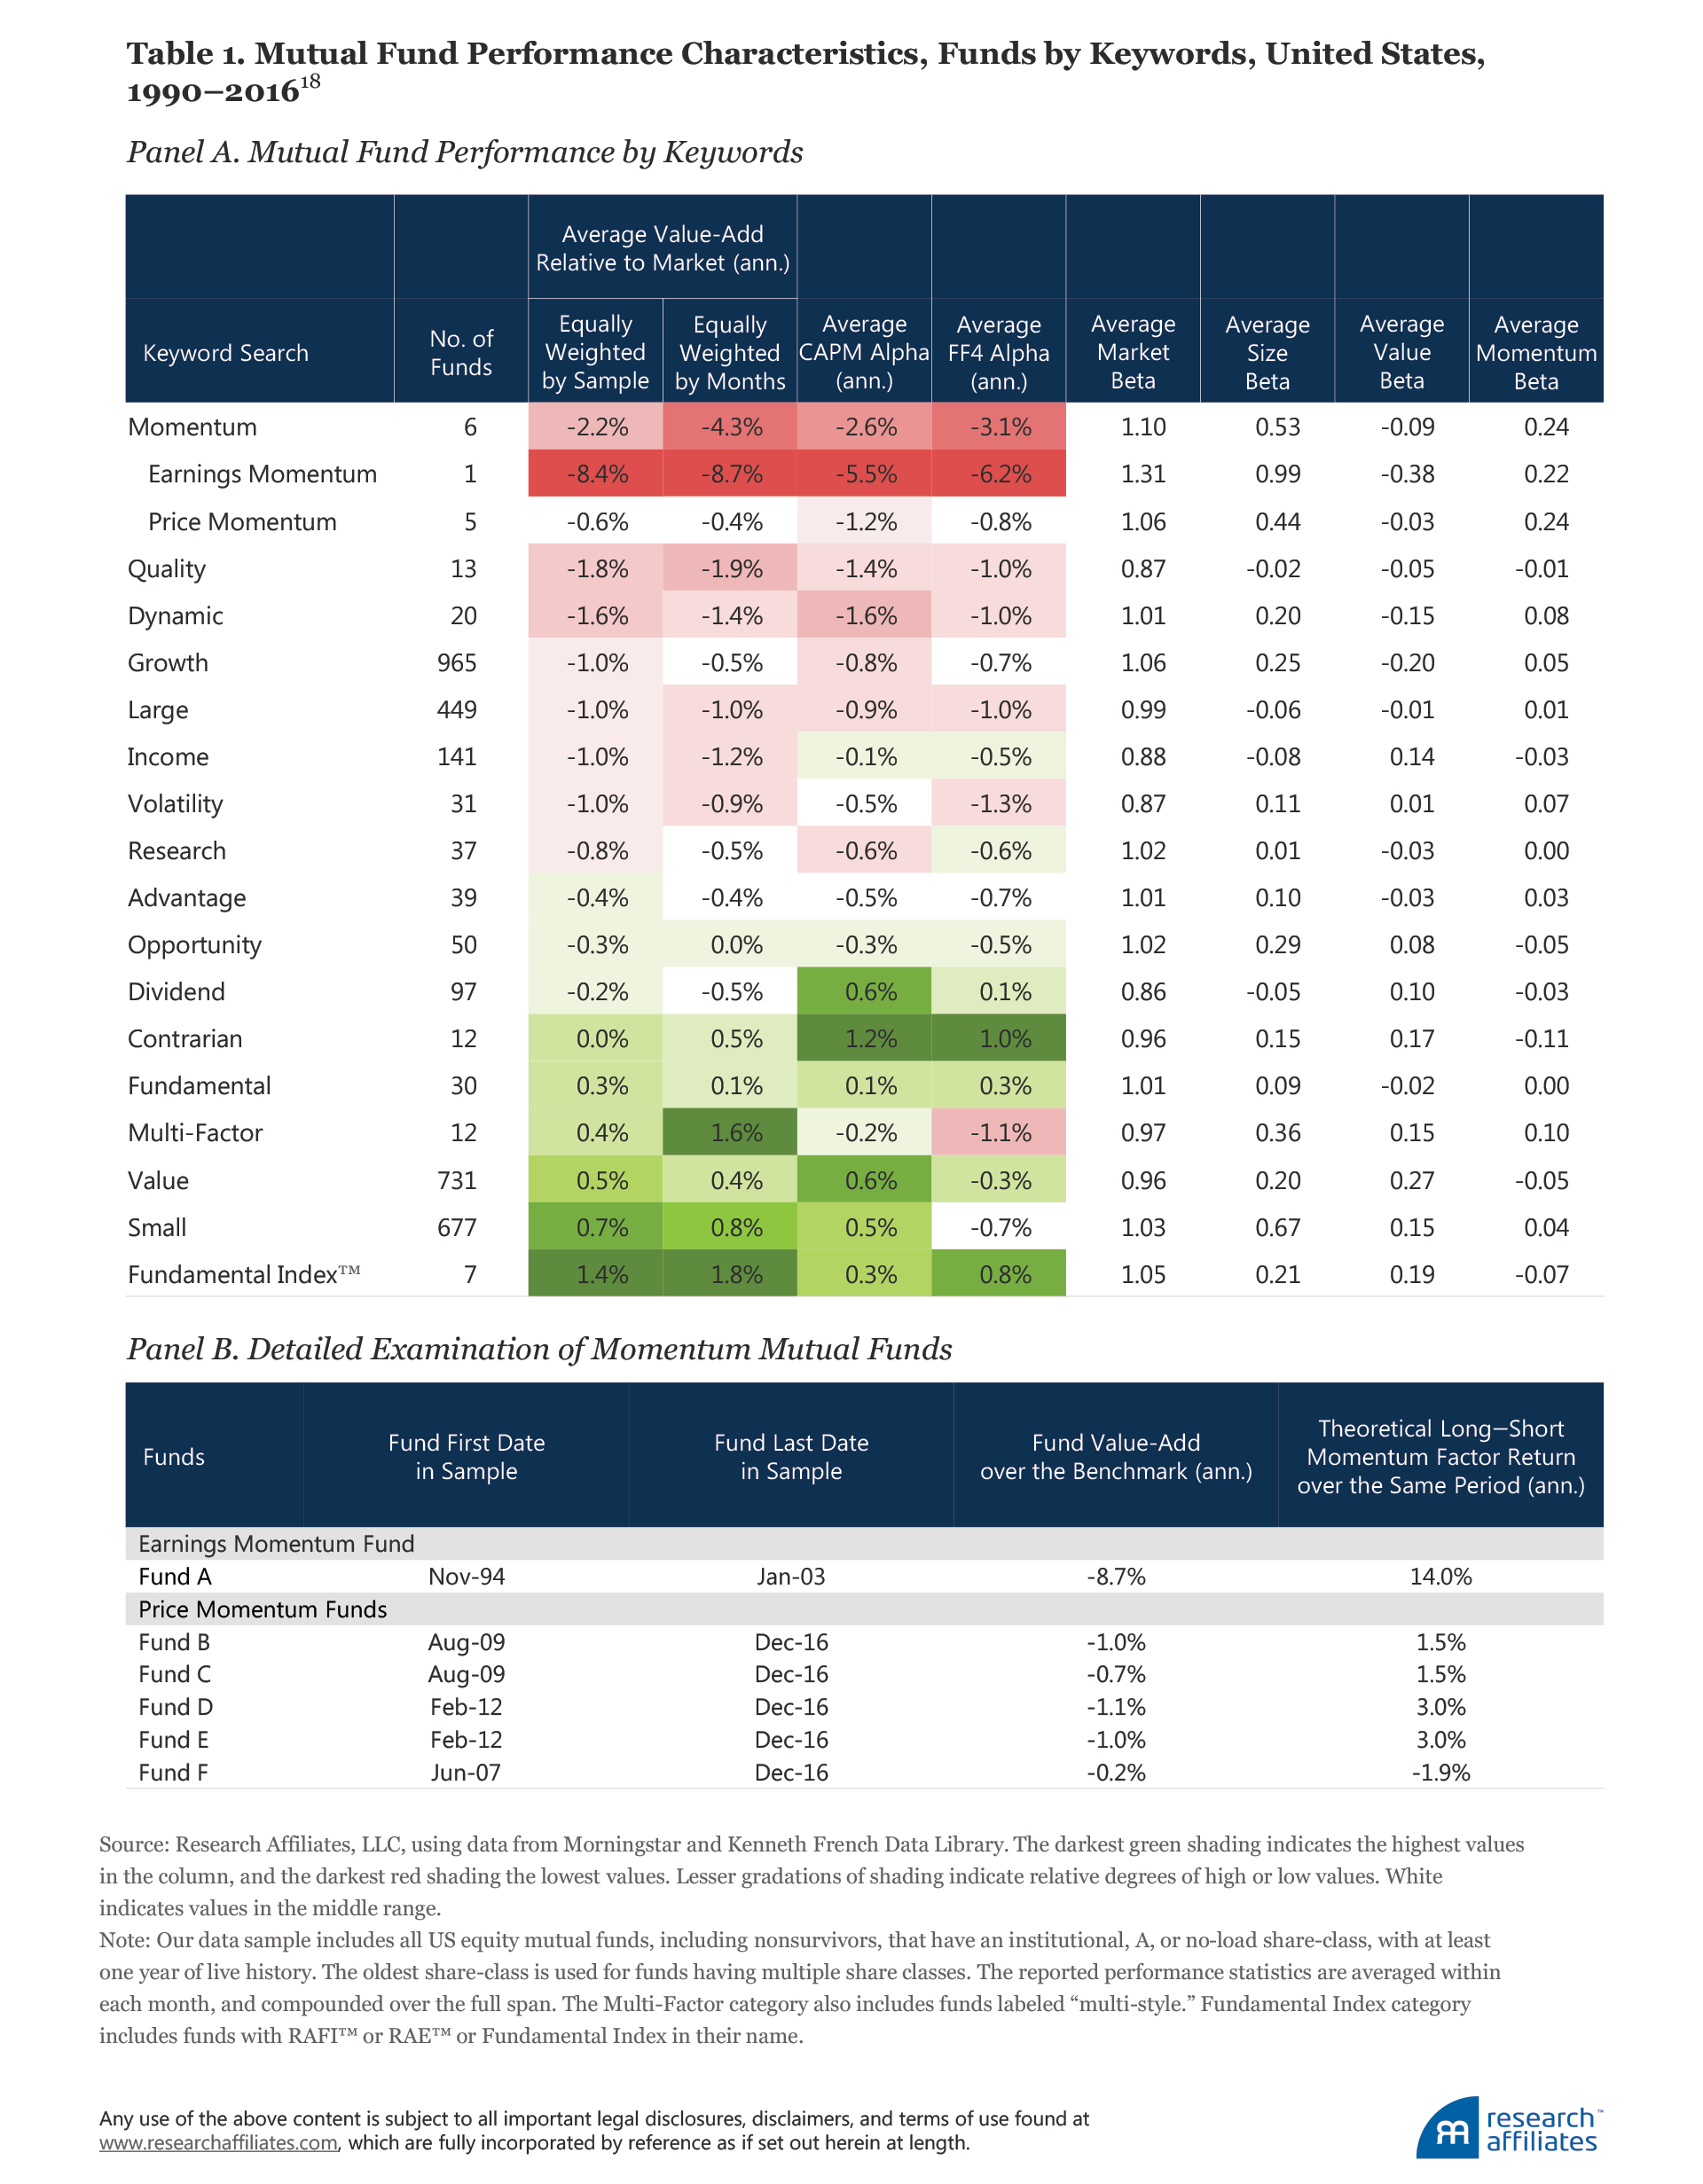
To be sure, the naming of a fund is more a marketing exercise than an objective statement of fund purpose. Nevertheless, it seems a reasonable assumption that if “momentum” is in the fund name, the manager must want to be perceived as a momentum expert. Six such funds with a US benchmark are in the Morningstar database. Of all the keywords we considered, these six funds with the keyword “momentum” have the highest average momentum loadings, validating they are indeed trying to benefit from momentum.
These so-labeled momentum funds were the worst-performing category of funds in our research in terms of value-add relative to the market. On average, they underperformed the market −2.2% a year when weighting by the first method, and by a whopping −4.3% a year using the second method. These funds yielded an average −2.6% CAPM alpha and −3.1% four-factor alpha (using the Fama–French three-factor model plus the standard momentum factor). In other words, the investors in these funds experienced a 3.1% annualized average shortfall relative to the performance of the paper portfolios their factor loadings were replicating. If these funds had been able to fully capture their factor premia, they would have outperformed the market by roughly 0.9% a year (3.1% better than their 2.2% average shortfall).
The small number of momentum funds in the database allows us to look at them in more detail. Only one fund, which self-identified with the tag “earnings momentum,” was live from November 1994 to January 2003. Not until four years later in June 2007 did any funds again use a momentum tag. Although earnings momentum and price momentum are definitely related (e.g., Novy-Marx, 2015, provides evidence that earnings momentum is the main driver of price momentum), the two are somewhat distinct. Therefore, we divide our sample into those funds labeled as earnings momentum and those labeled as price momentum in order to conduct a more detailed examination.
We report in Table 1, Panel B, the performance characteristics of the six individual momentum funds. As reported in Panel A of Table 1, the average annual underperformance of −2.2% a year (for still-extant funds, this is through year-end 2016),17 net of all trading costs and fees, is heavily skewed downward by the poor results of the single earnings momentum fund. But the other five funds hardly show exemplary results, even though the momentum factor has delivered a return of nearly 5.0% a year since the start of our study in 1990, and over 3.0% a year since the March–September 2009 momentum crash. As Panel B shows, only Fund F can blame the poor performance of the momentum factor for its low return. The other funds have underperformed in periods when momentum delivered a decent return on paper in the theoretical long–short momentum factor portfolio.
The performance of the earnings momentum fund was horrid, returning a whopping −8.4% a year and generating an annualized −6.2% four-factor alpha. Let’s not let the word “earnings” deceive us; this was a real momentum fund with a very strong momentum loading of 0.22—only a notch lower than the loading of the price momentum funds at 0.24. The other five funds, by contrast, fared significantly better. They underperformed the benchmark by “only” −0.6% a year using the first method (and by −0.4% by the second method), with a four-factor Fama–French alpha of “only” −0.8%.
Other fund groups that show a high momentum-factor loading are multi-factor and dynamic. The momentum loadings for these groups are 0.10 and 0.08, respectively (about one-half to one-third the 0.24 loading for the funds self-identifying as momentum). The multi-factor group outperforms the benchmark by 0.4% a year (1.6% by the second measure), while the dynamic group lags the benchmark by −1.6% a year (−1.4% by the second measure); the two have annualized four-factor alphas of −1.1% and −1.0%, respectively. (A brief analysis of the strategies with the other keywords listed in Table 1, Panel A, is provided in the appendix.)
We acknowledge the keyword method we use to examine the performance of the momentum funds has the potential to miss funds that are betting heavily on momentum, but do not choose to identify as such. To address this problem, we broaden our universe to include all funds ranked in the top 5%, based on correlation or beta, with each factor in the standard four-factor Fama–French model, each month. These funds have the highest correlation or beta exposure to one of the market, small-cap, value, or momentum factors.18 Our universe then expands to over 20 funds at the start of our analysis, and roughly 100 funds (80 to 110 funds) during the current decade.
In Table 2, Panel A, we report the performance characteristics of the funds with the highest factor loadings. We repeat the same exercise selecting the 5% of funds with the highest correlation of value-add to the list of factors, and display performance characteristics for this list of funds in Panel B. For momentum, this means we are looking for the 5% of funds with the highest momentum factor loading (the momentum beta in a multivariate four-factor Fama–French regression) in Panel A, or with the highest correlation of the fund’s excess return, relative to the benchmark, with the momentum factor in Panel B.
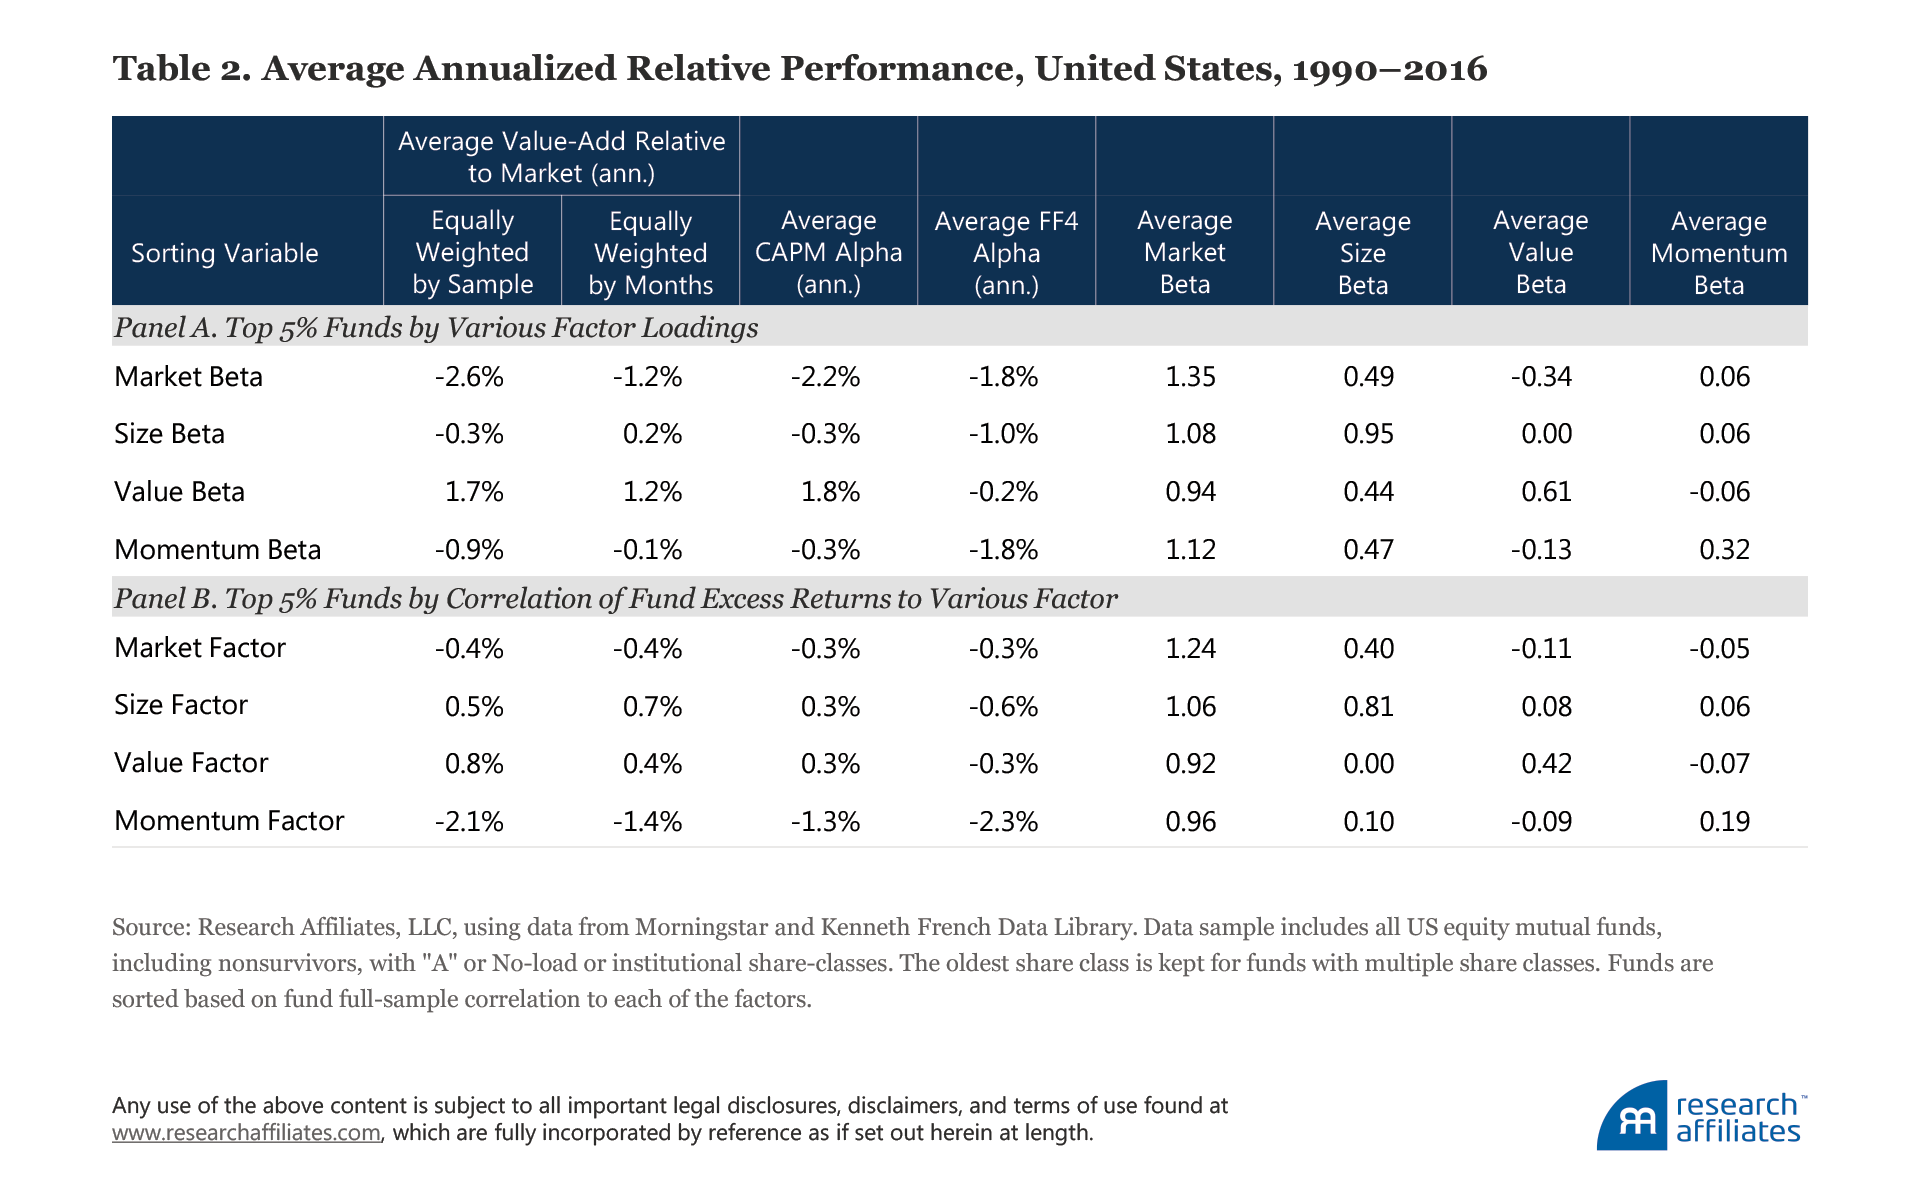
The first measure, which is based on a multi-factor regression, selects funds with the largest exposures controlling for the other factor exposures. Its drawback is that the regression coefficient may be sensitive to outliers. The correlation-based measure is somewhat less sensitive to outliers and is a function of how much of the fund’s value-add is explained by the specific factor exposure. The biggest difference is that selection based on correlation does not control for the other factor exposures. Despite the differences, the two methods yield quite similar factor exposures. In both cases the funds with the highest correlation to momentum have negative loading to value; many of these are growth funds. Funds with extreme market-beta loadings actually also have a high small-cap loading: small companies are known to have higher market beta exposure.
For the momentum factor, whether we are selecting based on the momentum factor beta or based on correlation with the momentum factor, each of the selected funds is objectively a performance-chasing momentum fund, ranking in the top 5% by one of these metrics. Again, the result is at odds with the momentum factor paper portfolio results. These funds underperformed the market −0.9% a year when we select managers based on their momentum factor loading and by −2.1% when we select the managers based on correlation with the momentum factor, during a quarter-century when the momentum factor was very profitable.
The funds with the highest value-factor loadings outperformed the market, on average, by 1.7% a year (1.2% by the second measure). The funds with extreme factor loadings on other factors showed underperformance: funds with highest market, size, and momentum factor loadings underperformed the market −2.6%, −0.3%, and −0.9% a year, respectively (−1.2% and −0.1% a year for the market and momentum factors by the second measure; and the size factor outperformed 0.2% a year by the second measure). All fund categories showed various degrees of negative four-factor alphas.19 For the small-cap and value factors—the original Fama–French factors—the shortfalls are not large. For the market and momentum factors, the negative alphas are responsible for all of the performance shortfall, with room to spare.20
When we select based on the correlation of a fund’s value-add over the market with factor returns, we observe that the mutual funds with high correlations to the market and to the momentum factor are the worst performers in the list with average underperformance of −0.4% and −2.1% a year, respectively (−0.4% and −1.4% a year, respectively, for the second measure). Size and value managers have pretty modest outperformance. The managers with a high correlation to each of the four factors have negative four-factor alphas, although most were only modestly negative, by a margin probably largely explained by their expense ratios. The outlier, once again, is momentum, with a negative four-factor alpha even larger than the performance shortfall. In Table A1 of the appendix, we display results for a similar exercise based on selecting the top 10% of funds based on either factor loading or value-add correlation; the results are directionally similar, although the magnitudes are (predictably) only about half as large, on average.
Mutual fund data show that investors are able to benefit (a little) from the value effect, net of all fees and trading costs. The same data show that investors are not able to benefit from the momentum premium, even during a quarter-century with robust paper portfolio performance. Once again, we observe a large (and highly economically significant) gap between the premium demonstrated by long–short momentum portfolios on paper and the returns earned by live funds. Momentum funds are generally unable to translate the high paper portfolio momentum premium into profits for their investors.
Mind the Trading Costs
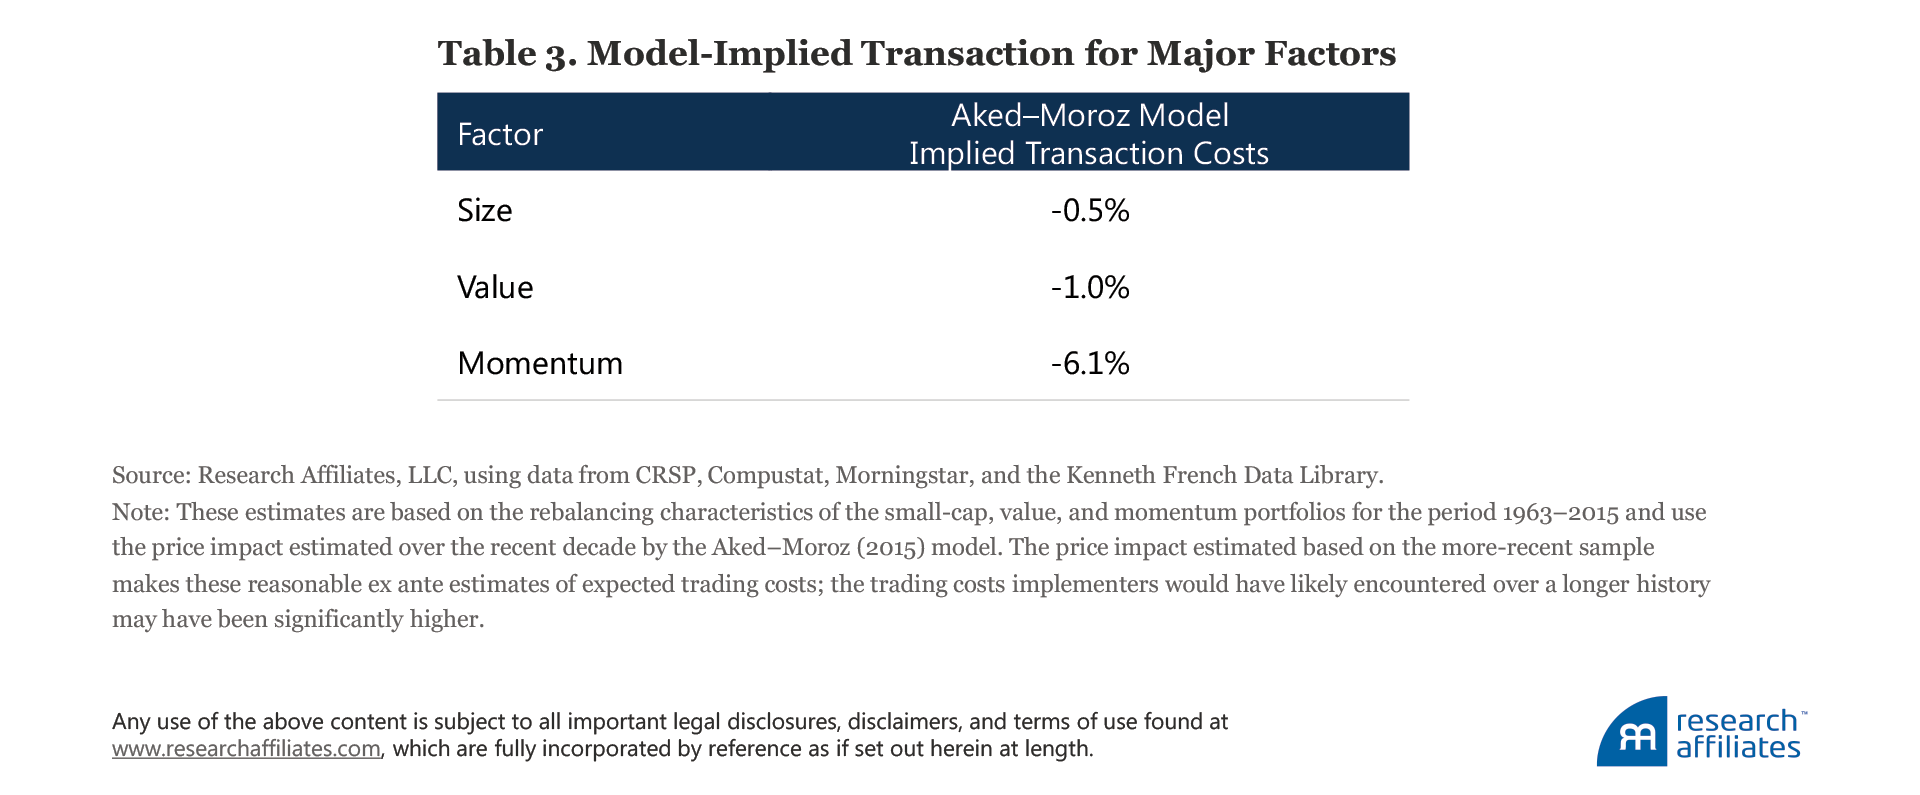
The literature identifies high transaction costs as a weakness of the momentum factor. We examine the price impact of trading costs and find that they make standard momentum, unless very careful (and clever) attention is paid to implementation, a very expensive strategy.21 To estimate the impact of trading costs, we use the Aked and Moroz (2015) model. The model estimates the market impact of trading to be approximately 30 basis points (bps), whenever turnover is equal to 10% of a stock’s average daily volume traded in aggregate. Assuming assets under management (AUM) of $10 billion, we estimate that trading costs for a momentum strategy are roughly 6 times larger than for a value strategy and 12 times larger than for a small-cap strategy. These estimates are for the long-only portfolio of a small-cap (size), large-cap value, and large-cap momentum strategy, and are reported in Table 3.
To better understand how the trading costs of a momentum strategy can be so eye-poppingly high, let’s look at the assumptions in the Aked–Moroz model:
- Trading costs rise linearly with turnover. If turnover doubles, all else equal, trading costs double.
- Trading costs rise with concentration of turnover. If turnover is spread evenly (i.e., proportional to average daily volume) across 100 stocks, the costs will be one-tenth as large as if the turnover is concentrated in 10 names (keeping other trading characteristics comparable).
- Trading costs rise with the weighted-average days of liquidity we are seeking to tap with our trade. If our transaction basket is 100% of the average daily volume for the underlying stocks, the costs will be nearly double that of a strategy sized at 50% of the average daily volume.
By these measures, momentum, illiquidity, and low-volatility strategies score badly, suggesting high trading costs and low capacity, while value and quality strategies tend to score well, as do low-turnover strategies such as indexing, equal-weight, and Fundamental Index™. It may be easy to argue with the magnitude of the numbers in Table 3. But if the basic assumptions of the Aked–Moroz model seem reasonable, it would be difficult to argue with the relative magnitude of these estimated annual transaction costs. In other words, momentum trading costs may or may not consume 6.1% a year (at $10 billion AUM), but they will very likely consume about 12 times as much as a small-cap strategy.
How We Can Save Momentum
Even though momentum has “worked” historically, delivering a terrific alpha in a long–short paper portfolio,22 momentum mutual funds have failed to capture this alpha. Trading costs are a very likely culprit of this discrepancy because turnover is exceptionally high, but in addition to minding trading costs, investors can take other steps to preserve the potential that momentum can bring to an investing strategy:
- Successful momentum investing is at least as reliant on its sell discipline as on its buy discipline. Most factors decay—they peter out over time—but they don’t turn against us. Momentum is different. It reverses after a few months, eventually giving up all of its gains and then some, for those who do not reverse their positions in time. As we will demonstrate, successful momentum investing requires that we eliminate stocks that no longer exhibit strong momentum, rather than waiting until they have poor momentum.
- Momentum can be divided into fresh and stale momentum, with very different results. Stocks that have exhibited strong momentum for two or more years are both very expensive and tired; this is stale momentum. Momentum essentially fails, especially net of trading costs, for stale momentum companies. 23
A momentum strategy, on average, favors expensive stocks. In periods when a momentum strategy becomes particularly expensive relative to the historical distribution of a stock’s price, that stock’s momentum tends to crash. Avoiding momentum exposures at the times when momentum strongly trades against value may be prudent as demonstrated by Arnott et al. (2016) and Arnott, Beck, and Kalesnik (2016a,b). Because our previously published research has examined this phenomenon in detail, we now turn our attention to gaining a better understanding of the benefits of a strong sell discipline and of avoiding stale momentum.
Sell Discipline Is More Important than Buy Discipline
Momentum factor returns, such as those shown in Figure 1, are generally calculated monthly, reconstituting a new long–short portfolio each month. The theoretical paper portfolio rebalances every single month, replacing the stocks in the long portfolio that are no longer soaring with new fliers, and replacing the stocks in the short portfolio that are no longer in freefall with new losers. This way the strategy is able to capture, over and over again, the strong returns typically earned in the first month (plus or minus its historical distribution uncertainty) of holding a long–short momentum portfolio. The problem is that in the real world, we cannot trade at month-end closing prices, for free, on an institutional scale. Lacking the ability to fully replicate the conditions the theoretical factor assumes, momentum’s payoff pattern shows a reward that tapers off pretty quickly.
Figure 3 illustrates the average buy-and-hold return of a standard momentum strategy, averaged across all overlapping 36 month spans from 1928 to 2016. Suppose we buy a cap-weighted portfolio of the 20% of stocks that performed best in the last 12 months—excluding the latest month—and sell short a cap-weighted portfolio of the 20% of stocks that performed worst over the same period—again excluding the latest month—and then hold that long–short portfolio unchanged for the next 36 months. Figure 3 describes the average payoff pattern of that strategy over the past 89 years.24 We do not subtract trading costs or fees, or add any short rebate.
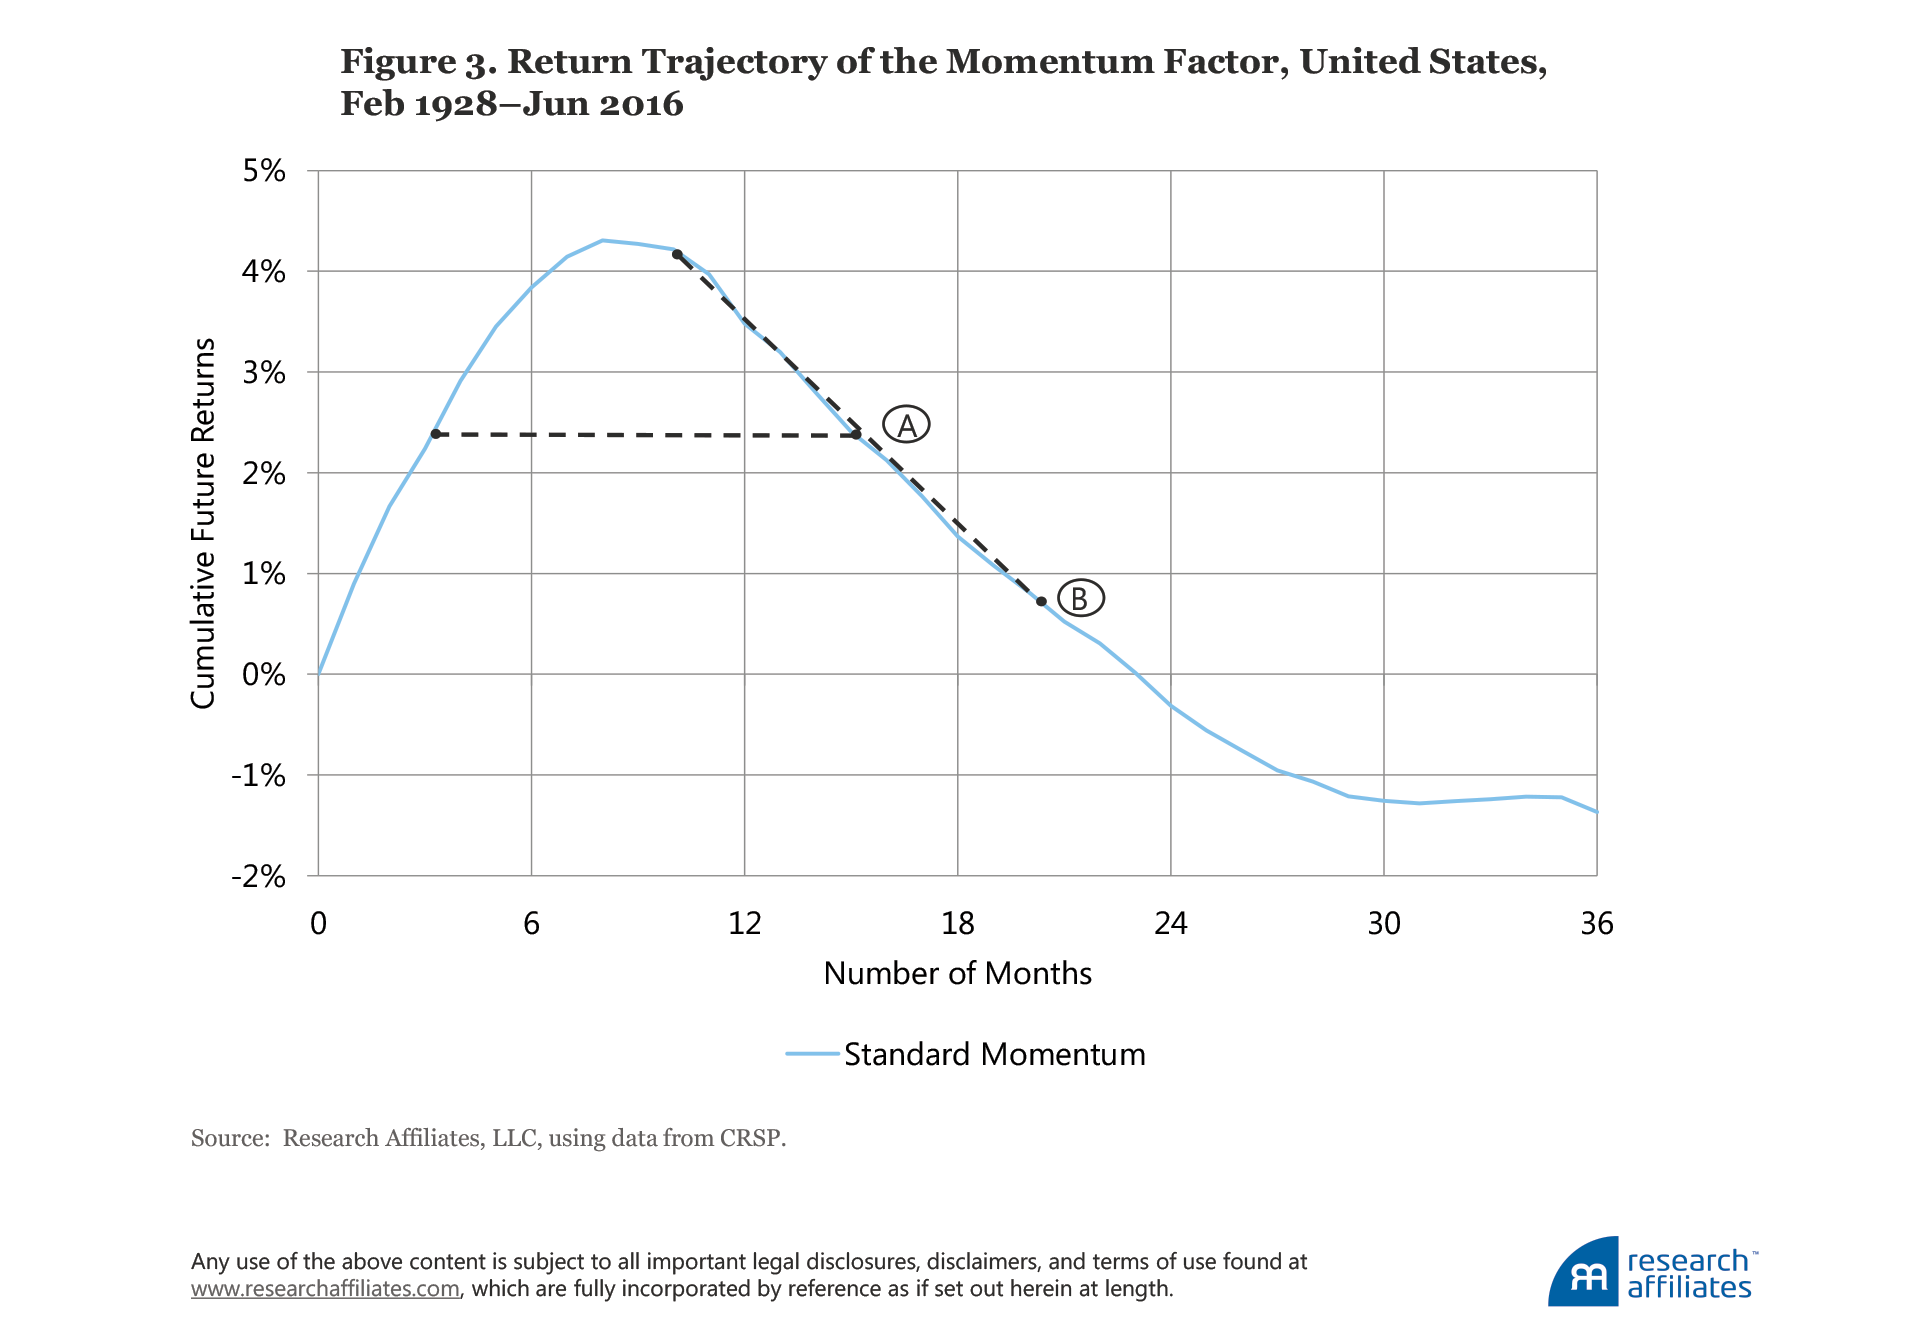
In the first month, our long portfolio beats our short portfolio by an average of 90 bps. If we were able to rebalance monthly—for free—we could capture that first month’s 90 bps, plus or minus a large uncertainty, every month, again and again. If we do not rebalance monthly, but keep the same portfolio, the strategy earns an additional 77 bps in the second month, then 57 bps in the third month, and so forth. After eight months, the momentum portfolio starts to lose money. After less than two years (24 months), the portfolio has lost all of its gains and is underwater. This makes intuitive sense because momentum has us buying more expensive stocks, on average, than the stocks we are short—both more expensive relative to their recent histories and (usually) more expensive in terms of valuation ratios.25
The value literature tells us that cheaper stocks outperform, on average, but with a long and slow payoff. Figure 3 vividly highlights a vulnerability in momentum investing: momentum has a half-life of barely three months, then value overcomes momentum, on average, in less than a year, and overwhelms its cumulative gain in less than two years.26 By contrast, value has a half-life measured in years, not months, and it never turns south. This means that with momentum—perhaps uniquely among all major factors—the sell discipline is extraordinarily important.
Let’s look again at Figure 3. Granted, the first month gives us nearly a 1.0% return, before trading costs, but if we hold the portfolio until momentum is flat on a 12-month basis, labeled point A on the figure, we would earn just 2.4% over 15 months, or 0.16% a month. Suppose we wait until momentum reaches the bottom quartile before we liquidate. That takes us to about point B, where we would earn an average of less than 1.0% over a two-year span on a long–short portfolio, without any allowance for trading costs or fees. Momentum has likely earned us nothing.
One way to deal with the sell-discipline problem is to never buy in the first place! We are not suggesting an investor should ignore momentum, but to consider using momentum to block trades initiated by other strategies. Suppose, for example, a value strategy tells us to sell a hot stock that’s on a tear. Suppose, at the same time, our value strategy tells us to buy a lousy company that is in freefall. If momentum is used to defer both of these trades until the momentum (strong for the former, weak for the latter) dissipates, then we are able to catch the early performance illustrated in Figure 3, without suffering from the later performance dissipation; when momentum dissipates, the trade would no longer be blocked.
On average, a stock in the momentum long–short portfolios (20% long and 20% short), drops out after about five months. Individual examples will be all over the lot, of course, ranging from far shorter to far longer. In our average experience, however, Figure 3 shows that we would have earned a 3.33% benefit on this pair of deferred trades in that first five months (or 8.0% a year).
To gauge the performance impact of momentum-based trade blocking, consider a value strategy with 50% annual turnover. Suppose that at least 20% of this turnover will be blocked. The actual amount is probably much higher because buys are more likely to have weak momentum than strong, and hence to be blocked, and sells are more likely to have strong momentum than weak, and hence to be blocked. Note that the blocking will not cut turnover, just delay the trades. If our strategy has 50% turnover, if 20% of the trades are deferred, and if trade blocking delivers 8.00% a year on each pair of blocked trades, we’ve just boosted the performance of our value strategy by 120 bps a year. Not bad!!
We know anecdotally that Dimensional Fund Advisors and a few other managers have been using this approach for almost as long as momentum has been a topic of academic study. We have also used this method for years. The trading costs are free, because we’re not doing any trading we weren’t going to do anyway.
What have we foregone because of missed trades? Nothing. We’re merely deferring trades until the momentum has fizzled. What incremental trading costs are we facing? None. Trades are deferred, none are initiated. What costs are we facing from the short portfolio in our momentum strategy? None, because we’re not shorting or leveraging our portfolio, merely blocking purchases that have terrible momentum, and that may be more sensible to buy when the stock’s price is no longer in freefall.
The sell discipline becomes a problem only if we are proactively using momentum to initiate trades. We then need a rule to decide when to reverse those trades. If we are initiating trades, the round-trip trading cost must be covered with the momentum alpha. If we fail to cover that cost with alpha, averaged across thousands of trades, then momentum will hurt us, not help us. We would surmise this is a major contributing factor to the observed slippage between the lofty paper portfolio returns for a long–short momentum factor over the last quarter-century and the zero-to-negative relative performance results for most momentum and momentum-tilted funds.
The Perils of Stale Momentum
Figure 3 showed the trajectory for momentum based on prior 12-month performance, ignoring all other information about the prior return. Some stocks selected in this mix are in the early stage of their momentum trajectory, having just experienced wonderful news that market participants have perhaps underreacted to; these stocks may generate a healthy momentum premium. Some stocks selected by this rule are in their second or third year of robust momentum (or for the short portfolio, in their second or third year of meltdown). These stocks are mostly already very expensive (or, for the short side, very cheap) due to market participants’ overreaction; they are unlikely to present any positive surprises (negative surprises for the wrung-out short stocks) for investors.
Figure 4 recreates the line in Figure 3, and also shows two special segments of our universe: stocks with fresh momentum and stocks with stale momentum. Following Chen, Kadan, and Kose (2012), we condition on the stock price movement prior to the last year—the period we use to identify momentum stocks.27 Thus, we form two additional portfolios within the momentum portfolio:
- Stale momentum portfolio. We select the 20% of stocks with the most extreme performance in the same direction that we used for momentum selection in the 12 months preceding the last year. The stocks in the long portfolio are among the 20% best performers in the previous 12 months; the stocks in the short portfolio are among the 20% worst performers in the prior 12 months. As such, each portfolio consists of only about 4% of the stocks in the market. The top quintile repeaters versus the bottom quintile repeaters.
- Fresh momentum portfolio. We select the 20% of stocks with the most extreme performance in the opposite direction to the one we used for momentum selection in the 12 months preceding the last year, and follow the same construction rules as outlined for the stale momentum portfolio. These are reversal portfolios and turnaround situations.
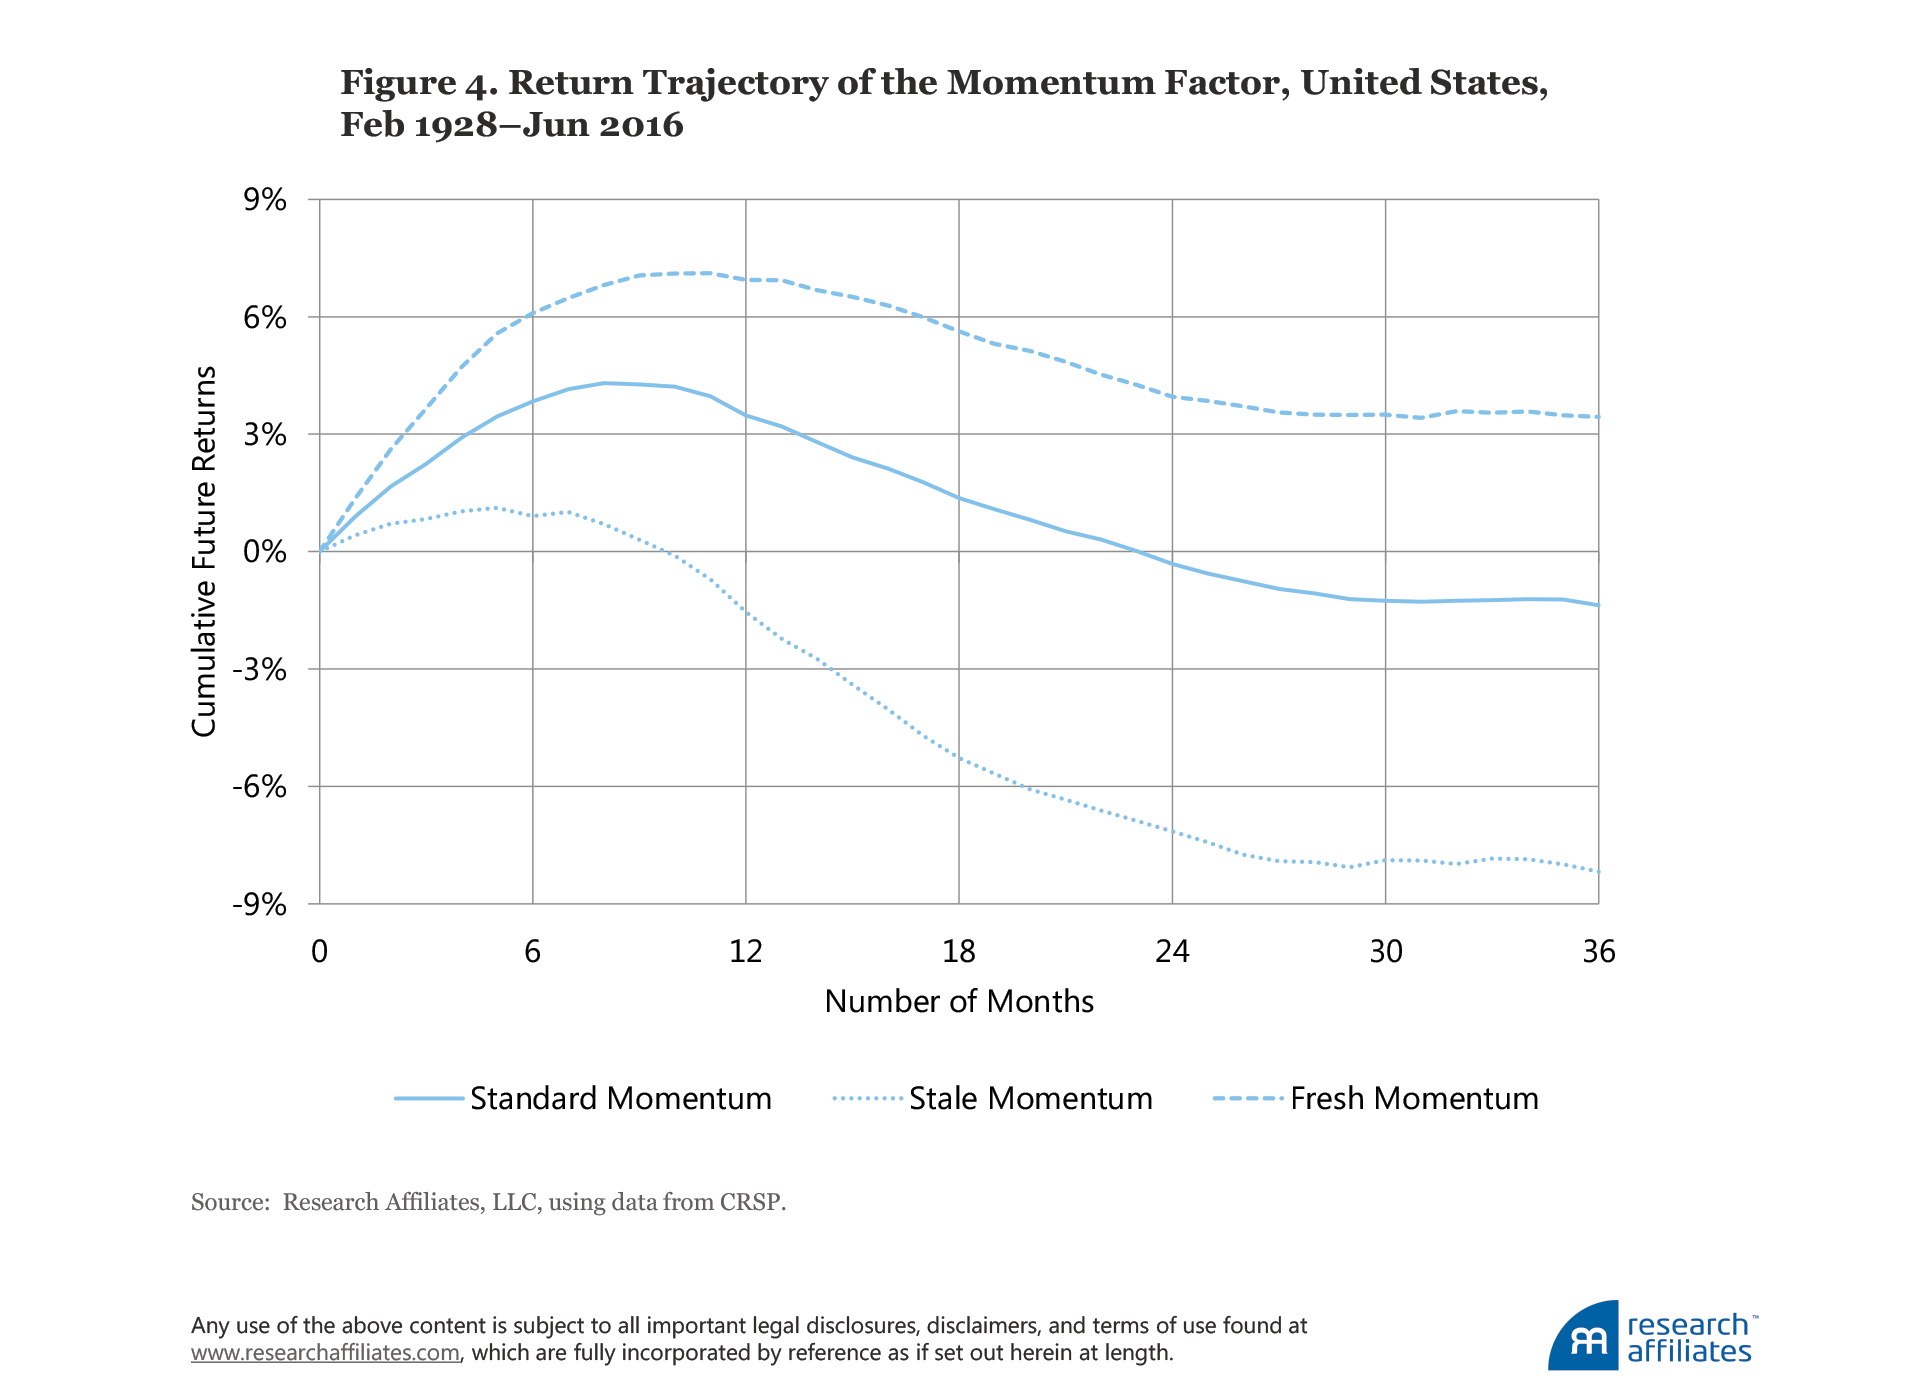
The cumulative performance for the stale portfolio reaches its performance peak at just over 1% by month 5, much earlier than the standard momentum peak. After this modest peak, the portfolio begins a relentless march downward, wasting all gains by month 10 and losing investors an impressive 8% by month 36.
Momentum funds should avoid stale momentum stocks, on both sides of the portfolio. Stale winners have little, if any, follow through; and stale losers are wrung out, cheap, and often ready to rebound. We leave it to others to examine whether the damage is greater on the long side or the short side, and whether the damage is more or less severe based on the actual valuation levels of the individual stocks in these portfolios.
Fresh momentum shows a much more attractive trajectory. The strategy reaches its cumulative performance peak of about 7% by month 11. Only about half of the gain is eventually ceded through mean reversion; even by month 36, fresh momentum still shows a respectable cumulative gain of almost 4%. The high cumulative performance reduces the need to trade too quickly and can reduce the total turnover and trading costs for the strategy. Recall, however, the portfolio is small, with only 4% of the market on either side of the long–short portfolio.
The best way to benefit from fresh momentum is not, as a first reaction to the graph might indicate, to shorten the holding period. Doing so would lead to prohibitively high transaction costs from high turnover, as well as eliminating the benefit of typically longer momentum follow-through on these stocks. Instead, the best approach is to avoid holding stale momentum stocks that have been on a momentum trajectory for two or more years.
In addition to plotting the cumulative performance for various holding horizons, we simulate portfolio returns over time using a more-typical monthly rebalancing cycle. We find that fresh momentum beats other momentum strategies on a reasonably consistent basis. After the tech bubble burst in 2000, fresh momentum shows modest continued gains, standard momentum is largely flat, and stale momentum performs horribly. That said, even fresh momentum has not yet bettered its 2007 peak. Figure 5 compares the cumulative performance of the standard momentum, fresh momentum, and stale momentum strategies.
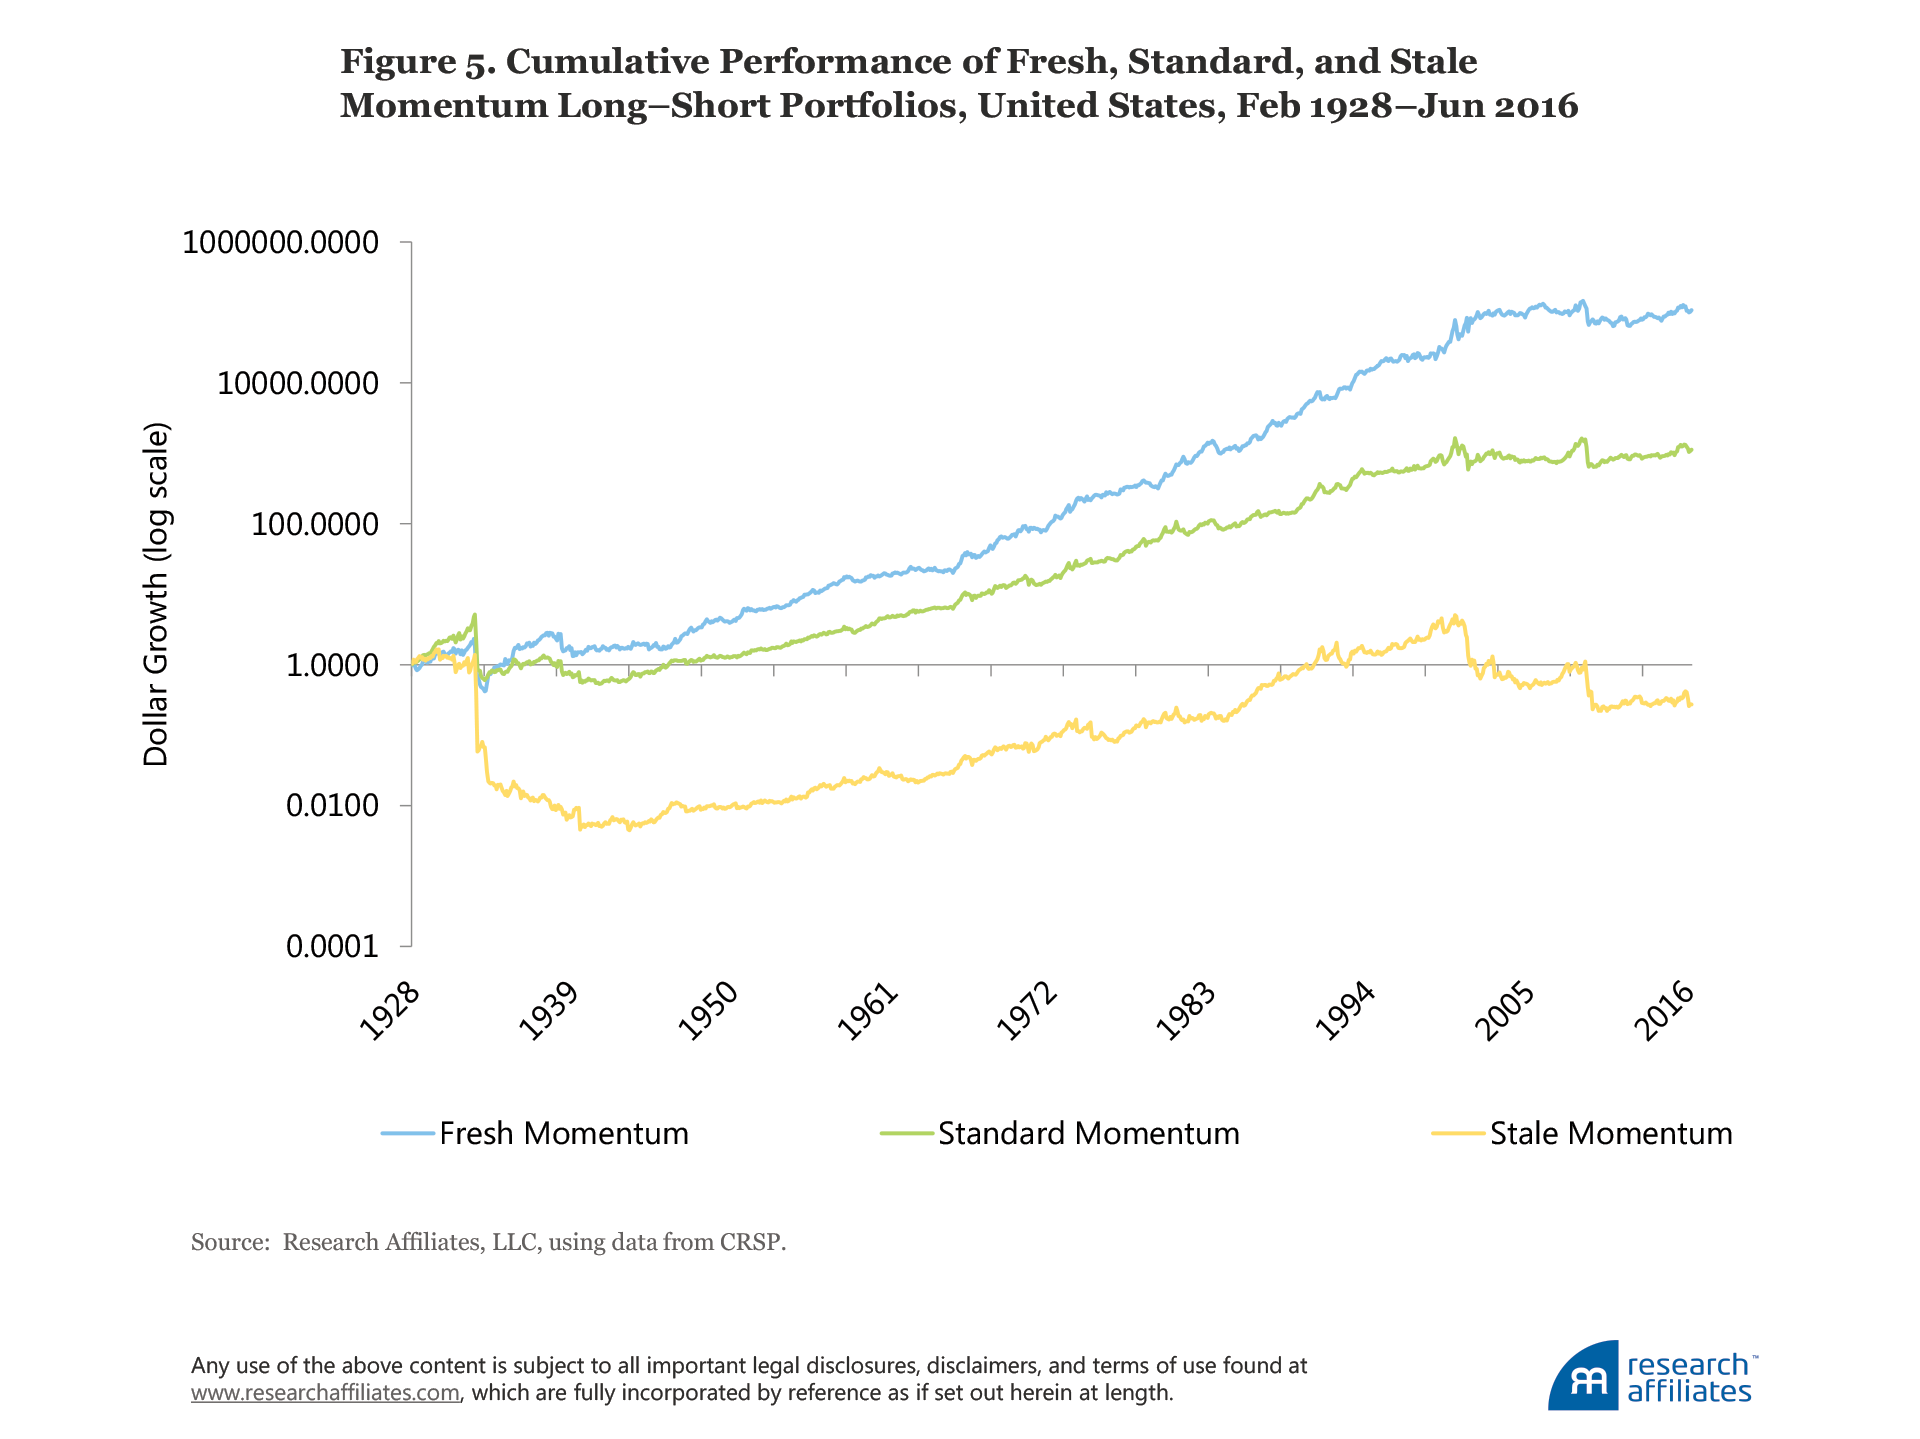
The famous momentum crashes—after the tech bubble burst in 2000 and after the global financial crisis in 2008—are much milder for fresh momentum and are beyond awful for stale momentum. After both crises, the long side of the stale momentum portfolio (almost entirely tech highfliers) fell nearly ten-fold relative to the stale momentum losers (almost entirely wrung-out deep-value companies). Even in the worst of all momentum crashes, the Great Depression, fresh momentum fared far better than stale momentum; stale winners lagged stale losers by nearly a hundred-fold.
Earlier in the paper, we observed that many momentum investors claim to use proprietary methods that are far better than standard momentum. We cautioned that these might only exist in rosy backtests, and that live results may suffer the same pitfalls as we have observed with standard momentum. In the interests of full disclosure, we acknowledge that the same caution applies to our work on fresh and stale momentum. As with any backtest, live results will likely be less impressive, and the potential for crashes may be worse than the backtest suggests. That said, the gap between stale and fresh momentum is intuitively sound and the statistical evidence is impressive.
Having the discipline to exclude stale momentum stocks—those late in their momentum cycle— can be an important step in overcoming the performance gap between paper and live portfolios. Fresh momentum stocks—those early in their momentum trajectory—can help reduce downside risk, improve performance, and allow for a less-demanding trading strategy, albeit on a skinny 4% slice of the market.
Conclusion
Momentum is a popular and seductive strategy. Human nature conditions us to want more of whatever has given us joy and profit and to get rid of anything that has inflicted pain and losses. Momentum delivers exactly this, as a formal strategy! It tells us to buy what’s hot and sell what’s not. On paper, this is associated with superior performance, all over the world, over long periods of time. Alas, momentum fares far worse on live assets than on paper. Historically, momentum funds—whether self-identifying as such, or objectively showing a strong momentum loading—have failed to beat the market, on average, even during extended periods when momentum factor paper portfolios were delivering outstanding performance.
One weakness of standard momentum strategies is that they do not distinguish between stocks as to whether they are early or late in their momentum cycles. We call the first group fresh momentum and the latter stale momentum. Stale momentum stocks are typically very expensive on the long side, and very cheap on the short side, with little likelihood of follow-through. Fresh momentum fares much better than stale momentum, especially since standard momentum went off the rails at the start of the current century. Investors will be better off if their strategies avoid stocks with stale momentum and instead rely more heavily on stocks with fresh momentum. If we’re going to incur trading costs to initiate momentum trades, we should perhaps concentrate those trades in the fresh momentum segment of the portfolio.
Another weakness of most momentum strategies is high turnover and high trading costs. Momentum funds use momentum to initiate momentum trades. Why don’t we turn this logic on its head? Why not use momentum to block (or at least condition) trades for other strategies, such as value, quality, low volatility, Fundamental Index, and so forth? Using momentum to block trades should improve performance on two levels. First, our strategy will be trading less, not more; after all, we incur no trading costs when we are deferring a trade. Second, the momentum effect—without trading costs—is one of the most robust in the literature, notwithstanding recent disappointments. If momentum—especially fresh momentum—improves the timing of our trades, we extract momentum alpha while reducing our trading costs, giving us the best of both worlds.
Momentum—at least as defined by the standard momentum factor—clearly does more harm than good on live assets in the mutual fund arena. It need not. It clearly needs saving. With a few simple steps, we think it can be saved, though not necessarily on a vast asset base.
The authors would like to thank Cam Harvey for his insightful comments on the article.
Copyright © Research Affiliates


