by Ryan Detrick, LPL Research
Few investments have been more frustrating than small caps in 2017. After a huge rally immediately following the U.S. election last November, the group weighed on the broad market this year-that is until September rolled around. Per Ryan Detrick, Senior Market Strategist, “Small caps were down for the year as of August 21; now they are up more than 11% —just behind the 13% gain for the S&P 500 Index. Although this was a popular trade this year, it also will go down as one of the more frustrating, as it took so long to get moving.”
To put things in perspective, on August 21, the Russell 2000 Index closed down 0.02% for the year versus the S&P 500 that closed up 8.47%. Small caps then closed higher 24 out of the next 32 days and made 13 new highs during a 19-day stretch, including eight in a row. So what happened? Many of the so-called “Trump trades” started to work in September, as hopes over tax reform started to heat up, as we discussed in our Weekly Market Commentary: “Markets Buying Into Tax Reform.” Remember, small caps pay a higher tax rate than large caps, so any potential tax reform would benefit this group significantly.
As we discussed in our Midyear Outlook: A Shift in Market Control, although small caps had lagged by a wide margin in the first part of this year, we expected an eventual move higher from the group and that has now happened. This leads to the next question: Can the strength continue? We think so.
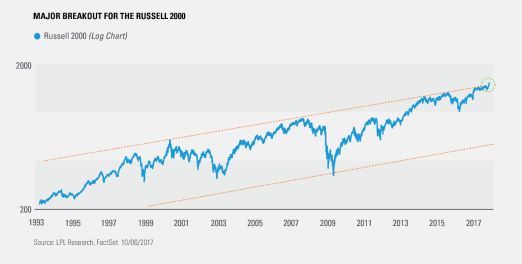
The Russell 2000 has been trading in an upward sloping channel since to the early 1990s, as you can see below. The top trendline slowed all rallies and capped small caps earlier this year. The good news is small caps have officially broken above this trendline, suggesting that continued strength and a continuation of the bull market is likely.
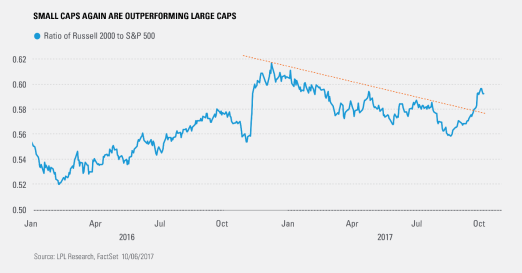
Last, small caps relative to large caps had a sharp breakout as well. As the next chart shows, small caps had been underperforming large caps all year, until the recent surge higher. This momentum is yet another technical indicator that small caps could continue to provide alpha as we move into 2018.
IMPORTANT DISCLOSURES
The economic forecasts set forth in the presentation may not develop as predicted.
Small cap stocks may be subject to a higher degree of risk than more established companies’ securities. The illiquidity of the small cap market may adversely affect the value of these investments.
The Standard & Poor’s 500 Index is a capitalization-weighted index of 500 stocks designed to measure performance of the broad domestic economy through changes in the aggregate market value of 500 stocks representing all major industries.
All Market Indices discussed are unmanaged and are not illustrative of any particular investment. Indices do not incur management fees, costs and expenses, and cannot be invested into directly.
The Russell 2000 Index is an unmanaged index generally representative of the 2,000 smallest companies in the Russell Index, which represents approximately 10% of the total market capitalization of the Russell 3000 Index.
Investing in stock includes numerous specific risks including: the fluctuation of dividend, loss of principal and potential illiquidity of the investment in a falling market.
This research material has been prepared by LPL Financial LLC.
To the extent you are receiving investment advice from a separately registered independent investment advisor, please note that LPL Financial LLC is not an affiliate of and makes no representation with respect to such entity.
Not FDIC/NCUA Insured | Not Bank/Credit Union Guaranteed | May Lose Value | Not Guaranteed by any Government Agency | Not a Bank/Credit Union Deposit
Securities and Advisory services offered through LPL Financial LLC, a Registered Investment Advisor
Member FINRA/SIPC
Tracking #1-652543 (Exp. 10/18)
Copyright © LPL Research


