by Jeffrey Saut, Chief Investment Strategist, Raymond James
October 9, 2017
History doesn’t always repeat itself, but it’s often instructive. In the final quarter of the year in which the market made highs in September – statistically the market’s worst-performing month – stocks have typically finished with a flair. Since 1928, there have been 29 Septembers in which the S&P 500 made a 12-month high. Following those 29 instances, the market rose over 80% of the time in the fourth quarter, averaging a 3.7% increase, says Doug Ramsey, chief investment officer of the Leuthold Group. Better still, 15 of those 29 September price highs were also accompanied by 12-month advance/decline line highs – as is the case now. Stocks increased an average 5.9% in the fourth quarter in those 15 instances. The sustainability of a new high is related to its underlying technical, monetary, and economic underpinnings, Ramsey says. “We expect higher highs in the fourth quarter,” he adds.
. . . Vito Racanelli, Barron’s (10-2-17)
Shakes off bad news and listens to good news! That’s how the past two weeks have been since the “melt up” began. As we wrote early last week (10-3-17):
According to Investopedia, “A melt up is a dramatic and unexpected improvement in the investment performance of an asset class driven partly by a stampede of investors who don't want to miss out on its rise rather than by fundamental improvements in the fundamentals.” “Unexpected” is certainly the right word because the recent rally was certainly unexpected by us. Now whether it’s continuing to “melt up” remains to be seen, but what has happened since a week ago sure resembles how such melt ups begin.
. . . Accordingly, this week should tell us if we are totally wrong on a trading basis, or just wrong for a week.
Obviously, last week the “melt up” continued as the S&P 500 (SPX/2549.33) gained 1.2% for the week and roughly a 2% gain since the “melt up” began on September 25, 2017. Playing no small part in the “melt up” has been the institutional cash cache, rather reluctantly being put to work in stocks. A case in point was a recent story we read disclosing that one famous money manager has 40% of his $30 billion portfolio in cash! We read that story with both amazement and amusement. Amazement because we were surprised the money manager admitted to the Wall Street world that he still had that huge cash position after nearly a 450 point rally (~21%) by the SPX since the presidential election. Amusement because he actually allowed himself to be quoted. All of this reminded us of a quote from one of Wall Street’s greats, namely Raymond F. DeVoe, who we knew in a past life. It was written in December of 1995 and titled, “What I learned About the Stock Market in 1995.” While there are nine “proven and probable tenets of investing” contained in said report, here are the two that just may apply to the current stock market environment. To wit:
This time it really is different. I don’t see why this isn’t obvious to everyone. This is a new era where old valuations no longer matter. You have to buy the concept and ignore everything else. This is the age of the New Valuation Paradigm [Andrew and I have written extensively about this and why stocks may not be all that expensive]. . . . Don’t talk to older people, your father’s friends or read Barron’s. They might convince you not to buy stocks and prevent you from making a lot of money. Just because they’ve had 40 years’ experience on Wall Street doesn’t mean that they know more than I do. They just don’t get it. Stocks go up. Period. Case closed.
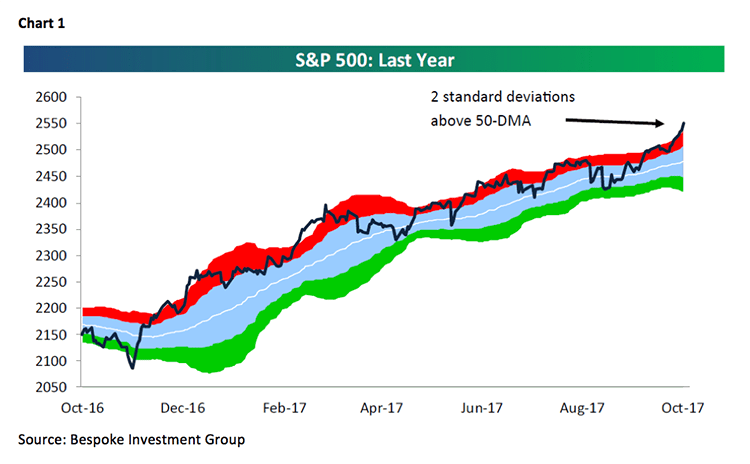
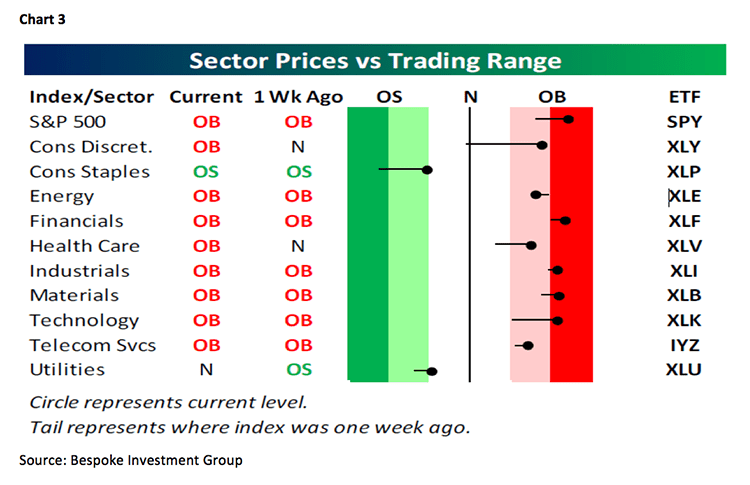
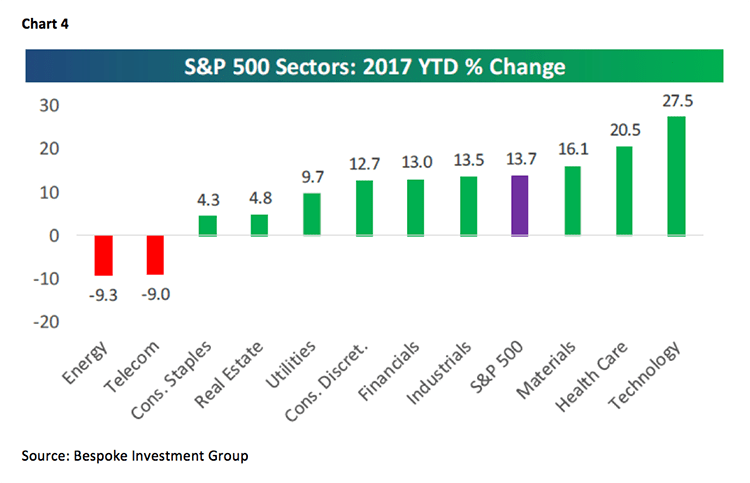
Moving on, the “melt up” has lifted the SPX above the parallel channel that has been intact for months, as well as vaulting it above the bearish ascending wedge chart formation previously referenced in these missives (Chart 1). It has also left the SPX two standard deviations above its 50-day moving average, which typically means it doesn’t get much more overbought than that before at least a pause or pullback develops. To be sure, the SPX is extremely overbought on a short-term trading basis (Chart 2). In fact, the “over-bought-ness” leaves all but two of the macro sectors (utilities and consumer discretionary) very overbought in the near term (Chart 3). Speaking to the sectors, we have favored the technology, healthcare, materials, industrials, financials, and consumer discretionary sectors for a long time. Three of those sectors have outperformed the S&P 500 year-to-date and three have not (Chart 4). More recently we have warmed up to the energy sector with particular emphasis on the master limited partnership space. Accordingly, we have been asked which names from the Raymond James research universe we favor. Our response has been, Energy Transfer (ETE/$17.92/Outperform), Energy Product Partners (EPD/$26.29/Strong Buy), and Genesis Energy (GEL/$24.44/Outperform). Of course, you could always consider one of the exchange traded funds (ETF), or mutual funds, that play to the midstream space. For additional ideas please refer to our fundamental analysts’ favored names.
The other sector we have embraced over the past few months has been the financials. Like the energy sector, the financials are “cheap.” The reason for that is the slow earnings growth rate. As Thomson Reuters notes:
The Financial sector has the lowest growth rate (6.2%) of any sector. It is expected to earn $45.6B in Q3 2017, relative to earnings of $48.6B in Q3 2016. Six of the 12 sub-industries in the sector are anticipated to see earnings decreases compared to Q3 2016, led by the reinsurance (-281.2%) and property & casualty insurance (-86.7%) sub-industries. If these sub-industries are removed, the growth rate improves to 0.6%.
That said, like the energy sector the financial sector has broken out to the upside in the charts. Here too, two of our fundamental bank analysts’ favored names are IBERIABANK (IBKC/$82.15/Strong Buy) and PacWest Bancorp (PACW/$49.14/Strong Buy). Hereto you could consider a financial-centric ETF, or a financial-centric mutual fund. The funds I own that play to this space are the Hennessy Small Cap Financial Fund (HSFNX/$26.16) and the Hennessy Large Cap Financial Fund (HLFNX/$21.56), both managed by my friend David Ellison, who I consider to be one of the best portfolio managers in the financial complex.
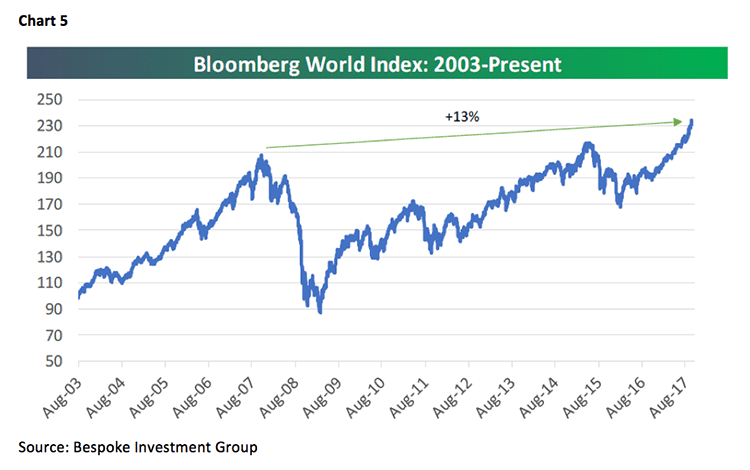
The call for this week: The major indices look pretty extended on a trading basis, however the international markets are not, and have actually rallied as much as the SPX year-to-date (Chart 5). Amazingly, this “melt up” has not been accompanied by even one 90% Upside Day where 90% of the total volume, and total points traded, come in on the upside. Worth mentioning is that last week the Buying Power Index crossed above the Selling Pressure Index suggesting the stock market should be higher in the months ahead even if we do get a pause and/or pullback in the near term. As our pal Doug Kass writes:
We can say nothing other than the fact that stocks continue to rise despite any and all sorts of measurements of “over-bought-ness” that one might wish to conjure up. We are a broken record of repetition, noting that P/Es are egregiously high; that price/book value ratios are egregiously high; that margin usage is egregiously high and that the CNN Fear & Greed Index is at its highest levels in the past decade . . . but it matters not; stocks just continue to advance. . . . We shall simply note once again that this remains a bull market and that one has no choice but to remain long of equities on balance; however as we have said countless times it seems to us, one needn’t . . . and indeed shouldn’t . . . be aggressively long. Modestly long seems to be the order of the day.
To which we add the famous quote from Sir Isaac Newton after he lost the equivalent of $2.7 million in today’s inflation adjusted dollars in the South Seas stock bubble (1720s), “I can calculate the motion of the heavenly bodies, but not the madness of people!”
Additional information is available on request. This document may not be reprinted without permission.
Raymond James & Associates may make a market in stocks mentioned in this report and may have managed/co-managed a public/follow-on offering of these shares or otherwise provided investment banking services to companies mentioned in this report in the past three years.
RJ&A or its officers, employees, or affiliates may 1) currently own shares, options, rights or warrants and/or 2) execute transactions in the securities mentioned in this report that may or may not be consistent with this report’s conclusions.
The opinions offered by Mr. Saut should be considered a part of your overall decision-making process. For more information about this report – to discuss how this outlook may affect your personal situation and/or to learn how this insight may be incorporated into your investment strategy – please contact your Raymond James Financial Advisor.
All expressions of opinion reflect the judgment of the Equity Research Department of Raymond James & Associates at this time and are subject to change. Information has been obtained from sources considered reliable, but we do not guarantee that the material presented is accurate or that it provides a complete description of the securities, markets or developments mentioned. Other Raymond James departments may have information that is not available to the Equity Research Department about companies mentioned. We may, from time to time, have a position in the securities mentioned and may execute transactions that may not be consistent with this presentation’s conclusions. We may perform investment banking or other services for, or solicit investment banking business from, any company mentioned. Investments mentioned are subject to availability and market conditions. All yields represent past performance and may not be indicative of future results. Raymond James & Associates, Raymond James Financial Services and Raymond James Ltd. are wholly-owned subsidiaries of Raymond James Financial.
International securities involve additional risks such as currency fluctuations, differing financial accounting standards, and possible political and economic instability. These risks are greater in emerging markets.
Investors should consider the investment objectives, risks, and charges and expenses of mutual funds carefully before investing. The prospectus contains this and other information about mutual funds. The prospectus is available from your financial advisor and should be read carefully before investing.
Copyright © Raymond James


