by Liz Ann Sonders, Senior Vice President, Chief Investment Strategist, Charles Schwab & Co
Key Points
- There is no shortage of things to worry about, but the market’s Teflon coating has prevented anything from sticking.
- Attitudinal sentiment measures are mixed, but behavioral measures show elevated optimism.
- Partisan conflict is an interesting and contrarian measure of “sentiment.”
The war of words between President Trump and North Korea’s Kim Jong Un has heated up; culture wars are raging; healthcare reform looks unlikely (again); Harvey, Irma, Jose and Maria have been uninvited and unwelcome visitors; there remains toxic partisan conflict in DC; and the Fed has taken a giant step toward monetary policy normalization.
The stock market’s reaction: What, me worry? There’s no shortage of things about which to worry, but the stock market’s Teflon coating has so far prevented any of the aforementioned uncertainties from sticking. Specific to the hurricanes, the S&P 500 has performed significantly better in the three weeks since Harvey hit than it did following Hurricanes Katrina and Sandy.
It’s time again for an update on investor sentiment, and the latest update of surveys and indices takes into consideration the stock market’s new highs; albeit highs which have come via small percentage gains and tight trading ranges. It should not come as a surprise that sentiment has become more optimistic; but the nuances are important.
Attitudes
Let’s start with the Crowd Sentiment Poll (CSP) from Ned Davis Research, which is an amalgamation of a number of individual sentiment indices. As you can see in the chart below, sentiment has rebounded further into “extreme optimism” territory; a zone in which stocks have experienced their lowest returns historically (see table).

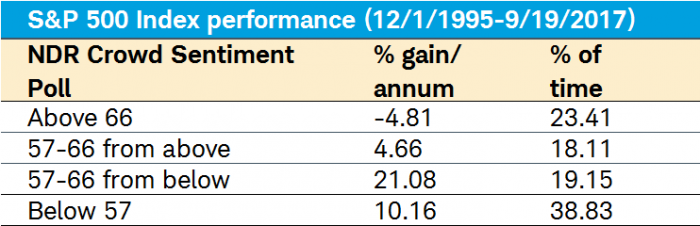
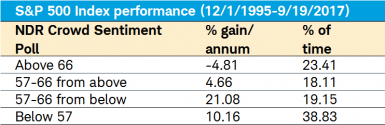
Source: Ned Davis Research (NDR), Inc. (Further distribution prohibited without prior permission. Copyright 2017 (c) Ned Davis Research, Inc. All rights reserved.), as of September 19, 2017.
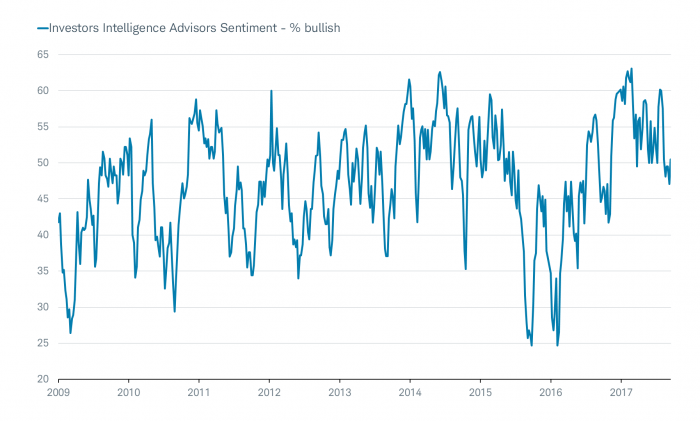
Two of the components within NDR’s CSP look at the sentiment of newsletter writers and individual investors. Through the Investors Intelligence Advisors Sentiment survey, we can see whether newsletter writers are expressing more optimistic or pessimistic views. It is one example of an attitudinal measure of investor sentiment. Interestingly, their optimism has lost some oomph recently.

Source: FactSet, as of September 15, 2017.
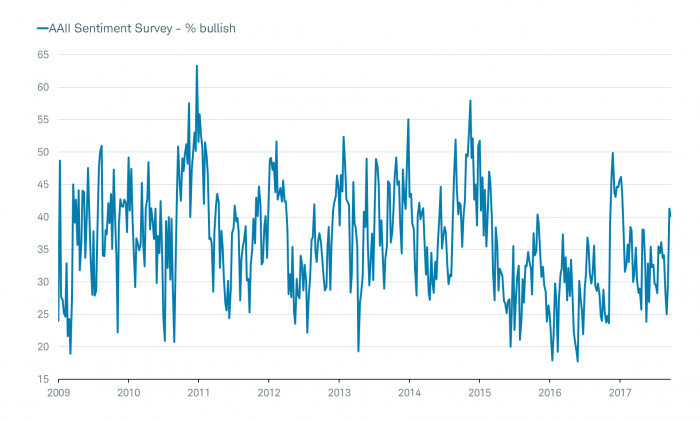
Moving on to individuals, the American Association of Individual Investors (AAII) sentiment survey asks a portion of their members for their views about the market each week. As such, it is also an example of an attitudinal measure of sentiment. As you can see in the chart below, sentiment has rebounded sharply recently, but it remains quite subdued relative to prior peaks in optimism seen so far in this bull market.

Source: FactSet, as of September 22, 2017.
Behaviors
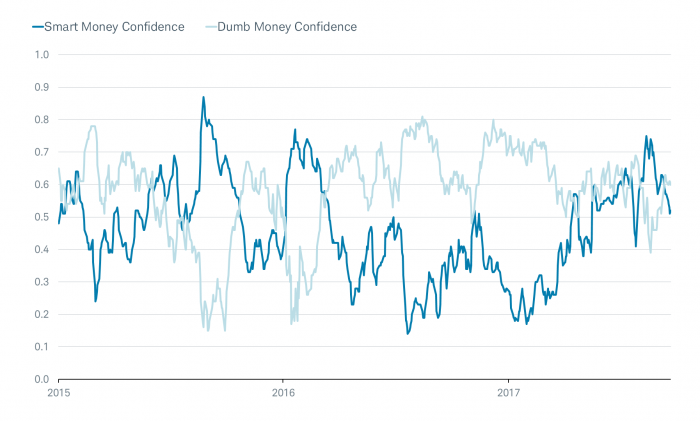
Separate from attitudinal measures of sentiment, we can look at those that measure the actual behavior of various cohorts of investors. One pair which I track on a daily basis—and one that’s typically included in these reports because of its popularity—are the “Smart Money” and “Dumb Money” Confidence indices put together by SentimenTrader (ST).
The indices are a unique innovation that allows ST’s subscribers to see, in one quick glance, what the “good” market timers are doing with their money compared to what “bad” market timers are doing. The indices use mostly real-money gauges—there are few opinions involved. Generally, investors should follow the “Smart Money” traders when they reach an extreme and do the opposite of what the “Dumb Money” is doing when they are at an extreme.
Examples of some Smart Money indicators:
- OEX put/call and open interest ratios
- commercial hedger positions in equity index futures
- current relationship between stocks and bonds
Examples of some Dumb Money indicators
- equity-only put/call ratio
- flow into and out of (bullish/bearish) Rydex series of index mutual funds
- small speculators in equity index futures
As you can see in the chart below, the latest move by the ST cohorts has meant they’ve crossed as they’re moving in opposite directions. The “Smart Money” has been getting more pessimistic, while the “Dumb Money” has been chasing stocks higher and has become more optimistic. This hasn’t yet reached one of the aforementioned extremes, but it’s worth watching.

Source: SentimenTrader, as of September 22, 2017.
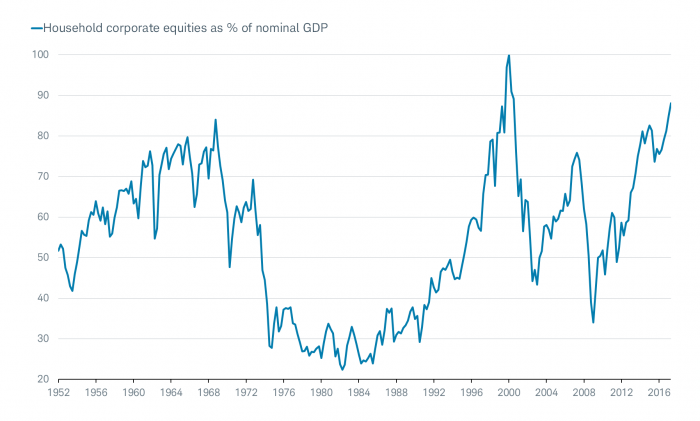
Another behavioral measure of investor sentiment comes from the Federal Reserve and shows the status of household assets in the United States. As you can see in the chart below, since at least 1952 (when the data series began), the stock market’s gains have pushed holdings of equities to nearly 90% of U.S. gross domestic product (GDP). This is the second highest in the series’ history, bested only by the peak in 2000.

Source: FactSet, as of June 30, 2017.
It’s not just individual investors who are more heavily invested. The National Association of Active Investment Managers surveys managers each week to track their exposure to stocks; ranging from -200% (leveraged short) to +200% (leveraged long). The managers tend to follow the broader trend, but are opportunistic and not hesitant to change quickly according to ST.
Notable is how hesitant any manager has been to go short the stock market recently. It has now been 12 weeks since any manager has dared to be short stocks on net—the longest stretch in the survey’s 15-year history. Even more remarkable, the most bearish investment manager is 40% net long the market, among the highest readings in a decade.
Let me circle back to where I began in this report, and touch on partisan conflict. It’s by no means a traditional investor sentiment reading, but given its heightened level, I thought a look at how it’s impacted the market historically might be of interest.
Partisan conflict
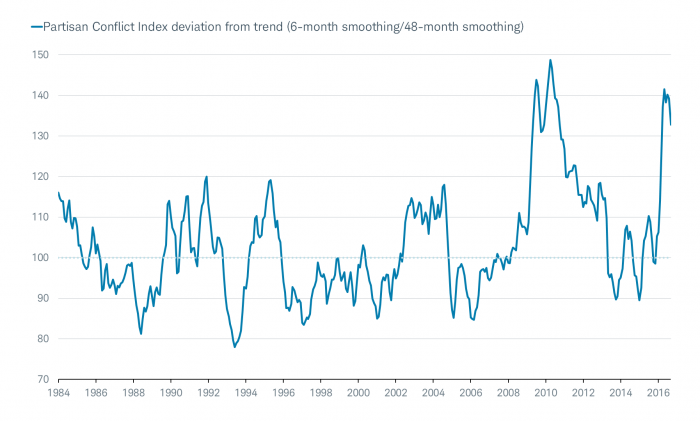
Believe it or not, partisan conflict has been similarly high in the past—notably in 2010, around the passage of the Affordable Care Act. The Federal Reserve Bank of Philadelphia (Philly Fed) captures the conflict with their “Partisan Conflict Index;” and on a non-smoothed basis (the chart below is smoothed), it hit an all-time high earlier this year.


Source: Federal Reserve Bank of Philadelphia, Ned Davis Research (NDR), Inc. (Further distribution prohibited without prior permission. Copyright 2017 (c) Ned Davis Research, Inc. All rights reserved.), as of August 31, 2017.
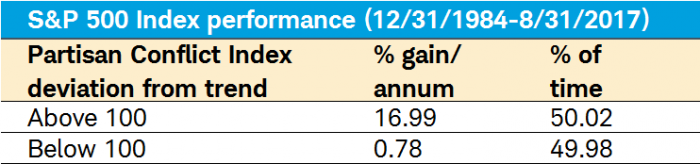
NDR has studied the relationship between partisan conflict and stocks and found that although higher-than-average partisanship implies a slower pace of growth, it has typically been met with better stock market performance.
Some of the possible explanations include:
- government cannot pass measures that might prove counterproductive
- high levels of partisanship might fuel investor pessimism (or at least keep optimism from getting out of hand)
The net
Investors’ attitudes are more muted than their behaviors; with the former likely impacted by the storm of uncertainty swirling around. But low volatility and elevated equity exposure suggest perhaps a bit too much complacency.
Time and the steady march higher by stocks have eased the painful muscle memory of the financial crisis and attendant bear market. I think the next bear market remains in the distance and will likely come only if it’s sniffing out the next recession and/or if monetary policy becomes much tighter. But I wouldn’t mind some fiercer pullbacks to keep excessively optimistic sentiment at bay.
Copyright © Charles Schwab & Co