by Carl Tannenbaum, Asha Bangalore, Northern Trust
SUMMARY
- The Parable Of The Broken Window
- Betting Against Disaster
- New Theories For Sluggish Wage Growth
It’s a little-known fact that I hold the world record for the 800-meter run. The record book says the mark was set by David Rudisha of Kenya in 2012, but that is incorrect.
One day during grade school many years ago, a group of my friends decided to play baseball in the schoolyard. School policy required the use of a rubber ball on such occasions, but we decided to use a real baseball that afternoon. During my turn at bat, I made unexpectedly solid contact with a pitch, sending it screaming through a second-story window. And immediately thereafter, I set the world record for 800 meters, the approximate distance between the playground and my home.
The recent U.S. weather disasters got me thinking about broken windows. This has been a particularly bad month for unfortunate events, but according to the AON Global Climate and Catastrophe Report, worldwide weather-related economic losses have been elevated for several years now.
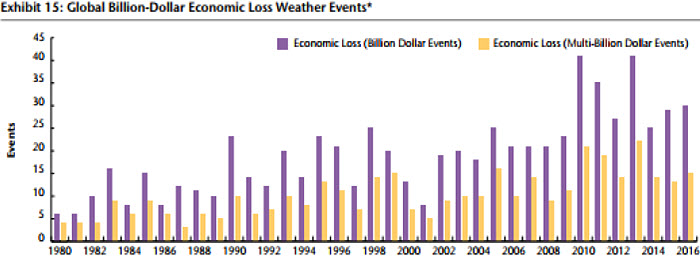
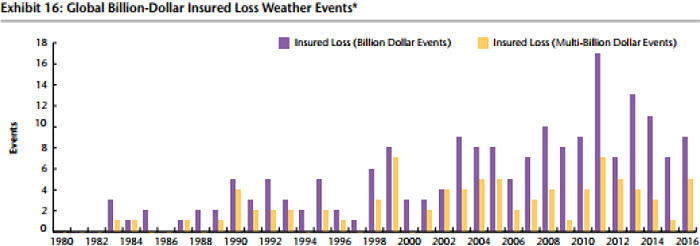
Economists have been working overtime recently to account for the impact of hurricanes Harvey and Irma. Damage assessments are still being completed, but estimates are nearing $200 billion in property and business losses.
Thankfully, the recovery is underway. And it clearly will generate a considerable volume of commerce. Consider:
- The cleanup will require crews to clear debris, repair power lines and cart away ruined possessions.
- Reconstruction of homes will require copious amounts of wood, shingles, insulation and other building products. Tradesmen skilled in working with these media will be busy for a long while.
- Scores of automobiles have been permanently damaged and will need to be replaced. U.S. auto demand has been disappointing this year, and the industry could use a boost.
- Infrastructure repairs will be required, and some areas may choose to upgrade in this area to be better prepared for the next emergency.
Spending in these categories accrues directly to gross domestic product (GDP). Indirectly, increased earnings for firms and professionals engaged in the recovery will lead to second-order effects as additional income is spent or invested. Disrupted production of goods and services in the affected areas is often recouped in the quarters following the disaster.
 The effect on future economic growth depends critically on the magnitude of insurance compensation and federal aid; the timing of disbursement drives the pace. Sadly, many world disasters strike populations that do not have the kind of insurance coverage and government resources we enjoy in the United States. In those cases, the devastation to both residents and businesses can be long-lasting. Without sufficient aid, productive
capacity may never be rebuilt, robbing an economy of its vitality.
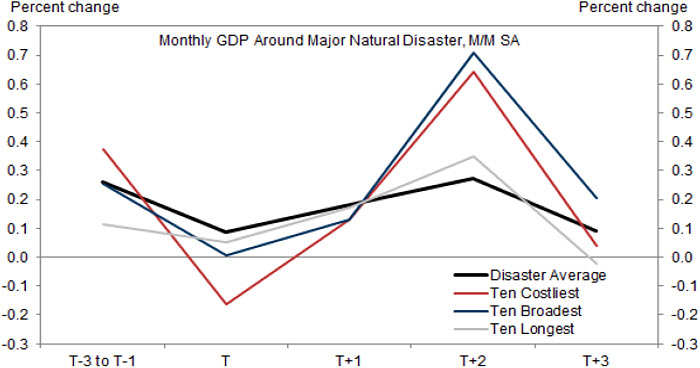
For developed countries, though, the aftermath of adversity can often generate important amounts of activity that would not have been otherwise undertaken. A study of U.S. disasters shows a pronounced increment of GDP growth in the quarters following the event.
But we would never wish for an increased cadence of disasters as a means to stimulate growth. Which brings me back to thoughts of broken windows. In 1850, the French economist Frédéric Bastiat advanced what has become known as the “broken window fallacy.” The parable involves a shopkeeper’s son who breaks a window. Rather than condemn the child, observers note the accident will benefit the local glazier. The income earned by the glazier will, in turn, ripple through the local economy and add to the general good.
Bastiat then extended his parable by suggesting that the glazier might be induced to pay young people to go around breaking windows, defending the practice on the grounds that the aftermath would be economically beneficial to the broader community. Bastiat noted, though, that the money used to repair windows could have been used in other ways. The shopkeeper could have purchased new shoes instead, raising the income of the local cobbler.
Bastiat contrasted the very visible signs of recovery from adversity with the hidden costs of unfortunate events. (He termed this contrast “what is seen and what is not seen.”) Bastiat asserted that the broken window has no net benefit to economic activity; it only creates a reallocation of resources. In the current day, relief funds could have been used to repair critical infrastructure in other parts of the U.S. Also unseen will be the increase in insurance premiums that will almost certainly be implemented.
 But a Keynesian would certainly observe that if an economy is struggling with an excess of saving, things that promote additional spending may be welcomed. Depending on the nature of the spending, multiplier effects could be substantial; infrastructure investment is thought to have particularly attractive long-term returns. And as we discussed last week, reinforcing disaster preparedness today could save substantially (in money and lives) later on. This is a lesson that communities beyond Texas and Florida may be appreciating more today than they did a month ago, and more resources may be appropriated for this purpose.
Having debated this topic for 167 years, economists will no doubt fail to reach a conclusion for another 167. But the calculus of the broken window parable deserves attention as we think about this month’s disasters. In my case, the broken window calculus was $150, after my “friends” ratted me out to the principal. My GDP took a long time to recover.
Tale of the Tails
The hurricane damage is done, and the question now becomes who pays for it. The answer may come down to institutions and investors who make their livings by taking tail risk.
Ninety-five percent of Americans have homeowner’s insurance, which is provided by traditional property and casualty companies. The terms of those policies aren’t entirely uniform; deductibles, limits and reimbursement rates can vary. Damage due to flooding requires a separate policy; only about 20% of Houston-area residents had this protection, meaning reconstruction may have to be financed by personal assets or federal aid.
Property/casualty carriers should be in a good position to cover physical losses for homeowners and businesses. We generally take for granted that insurance companies can perform on their obligations when called upon. The industry is well-capitalized, and returns on invested premiums have been strong over the past several years.
First-line insurers take some of their risk off the table by selling it to reinsurance companies. Warren Buffett’s Berkshire Hathaway is an industry leader in this space, along with European giants Swiss Re and Munich Re. In total, primary insurers pay premiums of nearly $200 billion annually to hedge against extraordinary circumstances.
Underwriting reinsurance is an especially specialized discipline. By its very nature, it is trying to assess the probability and cost of events that are infrequent, and for which past precedents aren’t the best predictors of future losses. (No two hurricanes are alike.) Reinsurance payouts have averaged about $45 billion annually over the past ten years, but the industry has still performed very well.
Nonetheless, the shares of the reinsurance community came under pressure after hurricanes Harvey and Irma struck the United States. Reinsurers will almost certainly be called upon to pay benefits to primary insurers, although the reinsurance industry appears to be well-capitalized and each disaster adds a data point that may allow for premium increases going forward.
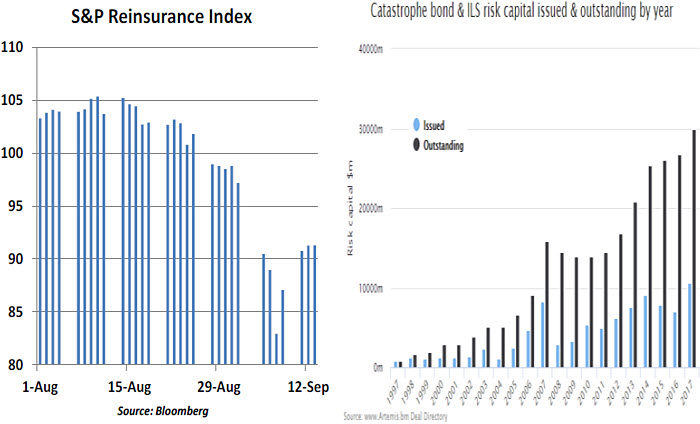
 Reinsurance companies control their vulnerability by issuing “catastrophe bonds” (cat bonds, for short) to investors. Originated in 1990, these securities have a simple structure. If there is no disaster, the owner’s principal is returned, along with an interest payment. If there is a disaster, the holder of a cat bond forfeits the principal, which is then used to pay reinsurance claims.
Cat bonds are typically written to cover very specific risks. For example, rather than being liable for any hurricane-related claim, the holder will agree to cover storms that hit a very specific geography. Cat bonds have proven popular with asset managers and hedge funds because of their generous returns (6% to 8% above U.S. Treasury yields of comparable maturities) and the absence of performance correlation with other asset classes.
Those participating in the cat bond market typically own them through funds, or construct a well-diversified portfolio that isn’t overly vulnerable to a single event. The maximum annual loss for the sector occurred after Hurricane Katrina in 2005, but that amounted to only 4% for the cat bond universe.
In the wake of Hurricane Irma, the prices of cat bonds came under pressure. Those designed to provide coverage for damage in Florida saw their prices initially slump by more than 40%. This led to some concern that the storms could create financial contagion if there was a wholesale exodus from the sector. But conditions have stabilized as the skies have cleared.
Given the increasing frequency of extreme events, some additional attention to reinsurance and catastrophe bonds is probably warranted. But for now, the system is working as designed.
On A Treadmill
Obituaries for the Phillips Curve are being authored all over the world. Unemployment stands at low levels in many developed countries, but wage growth seems stuck. That combination goes against the identities in many macroeconomic models, sending central bankers (and bank economists) searching for explanations.
We’ve offered our reasoning before, but a couple of new angles have recently emerged. The first comes from the Federal Reserve Bank of San Francisco, which recommends we look at the labor market as a kind of escalator. Some get off at the top, while others enter at the bottom. Since those at the top earn more, migration onto and off the escalator explains the depression in wage growth.
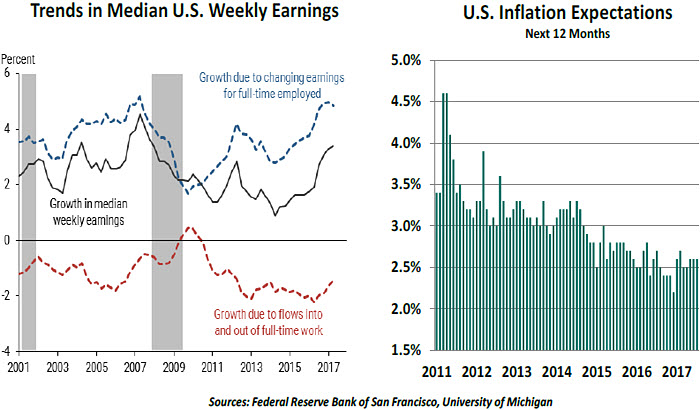
 There are several problems with this analysis. Firstly, the degree of wage suppression due to flows into and out of full-time work is about the same today as it was in 2006, when wage growth was in excess of 4%. Secondly, the data used in the study comes from a second-tier series; we do not see the same trends in the more comprehensive hourly earnings release
that highlights each month’s job report. And finally, the approach considers age as the main
driver of the escalator, and does not make any allowances for changes in worker quality or productivity.
The second novel thought is somewhat more intuitive. Wage demands are driven, in part, by inflation expectations, as workers seek to sustain their purchasing power. (That doesn’t mean employers will accede to this demand, just that it serves as an influence.) Inflation and inflation expectations have been declining significantly over the past several years, raising real wages. This may reduce the bargaining ambitions of some employees.
We’re all looking for explanations on sluggish wage growth, trying desperately to resuscitate the Phillips Curve. The patient – and wage growth – are still flatlining.
northerntrust.com
Information is not intended to be and should not be construed as an offer, solicitation or recommendation with respect to any transaction and should not be treated as legal advice, investment advice or tax advice. Under no circumstances should you rely upon this information as a substitute for obtaining specific legal or tax advice from your own professional legal or tax advisors. Information is subject to change based on market or other conditions and is not intended to influence your investment decisions.
© 2017 Northern Trust Corporation. Head Office: 50 South La Salle Street, Chicago, Illinois 60603 U.S.A. Incorporated with limited liability in the U.S. Products and services provided by subsidiaries of Northern Trust Corporation may vary in different markets and are offered in accordance with local regulation. For legal and regulatory information about individual market offices, visit northerntrust.com/disclosures.
Copyright © Northern Trust


