by Russ Koesterich, Portfolio Manager, Blackrock
alue stocks have largely sat out the broader market rallies this year. Russ explains why, and what could spark a return to investor favor.
Despite stalling in recent weeks, U.S. equities remain at or near historical highs with many indexes enjoying double digit gains. But not all segments of the market have fared so well: Many of the reflation trades that dominated late 2016 have reversed. This has been most evident at the style level.
After a stellar second half of 2016, value stocks have largely sat out this year’s rally. The S&P 500 Value Index has gained roughly 3% year-to-date, a bit of an embarrassment compared to the 15% rally in the S&P 500 Growth Index.
Why has growth done so well while value has barely merited a look by investors? A couple of factors help explain the performance gap.
Mean reversion
While growth has crushed value year-to-date, the one-year performance numbers are more balanced: 9.6% for value and 14.5% for growth. Part of growth’s outperformance year-to-date simply reflects some “catchup” after value’s strong run in the back half of 2016.
Moderating expectations for economic growth
Although the U.S. economy is firm, we’re not seeing the pickup in U.S. growth and inflation that many had expected. Most measures of inflation have decelerated and expectations for economic growth have softened. Based on a Bloomberg survey of economists, 2017 U.S. growth expectations have fallen from 2.30% in February to 2.10% today. This is important as value tends to perform better when economic expectations are rising. In contrast, when economic growth is modest, investors are more likely to put a premium on companies that can generate organic earnings growth, regardless of the economic climate. This dynamic helps explain the strong year-to-date rally in technology stocks.
What could change this dynamic? Two things to watch, the first being events in Washington, D.C. Economic estimates have slipped in part because investors and economists have put a lower probability on tax reform and/or fiscal stimulus. If Congress started to evidence real progress on tax reform, economic expectations would likely rebound along with investor’s preference for value.
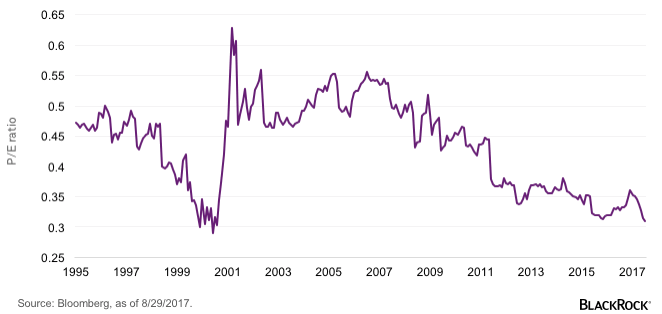
If Washington cannot rescue value, eventually investor excess will. When value outperformed in late 2016, it was the exception that proved the post-crisis rule: This has been a growth-led rally. Growth has trounced value since the market bottomed in early 2009. As a result, the relative value gap between the two styles is back to levels last seen at the peak of the late 90s tech bubble.
Since 1995 the average ratio between S&P Value and Growth price-earnings (P/E) ratios has been 0.45, i.e. value typically trades at a 55% discount to growth. Currently the ratio is 0.30, close to two standard deviations below the long-term average. Value has not been this cheap relative to growth since early 2000.
S&P Value to Growth P/E Ratio
Relative value is a poor short-term timing mechanism, but at some point investor preferences will shift. After all, this is not the first time that value has been left for dead.
Russ Koesterich, CFA, is Portfolio Manager for BlackRock’s Global Allocation team and is a regular contributor to The Blog.
Investing involves risks, including possible loss of principal.
This material is not intended to be relied upon as a forecast, research or investment advice, and is not a recommendation, offer or solicitation to buy or sell any securities or to adopt any investment strategy. The opinions expressed are as of August 2017 and may change as subsequent conditions vary. The information and opinions contained in this post are derived from proprietary and nonproprietary sources deemed by BlackRock to be reliable, are not necessarily all-inclusive and are not guaranteed as to accuracy. As such, no warranty of accuracy or reliability is given and no responsibility arising in any other way for errors and omissions (including responsibility to any person by reason of negligence) is accepted by BlackRock, its officers, employees or agents. This post may contain “forward-looking” information that is not purely historical in nature. Such information may include, among other things, projections and forecasts. There is no guarantee that any forecasts made will come to pass. Reliance upon information in this post is at the sole discretion of the reader. Past performance is no guarantee of future results. Index performance is shown for illustrative purposes only. You cannot invest directly in an index.
©2017 BlackRock, Inc. All rights reserved. BLACKROCK is a registered trademark of BlackRock, Inc., or its subsidiaries in the United States and elsewhere. All other marks are the property of their respective owners.
Copyright © Blackrock


