Are smart beta ETFs skewing stock valuations?
by Eric Pollackov Global Head of ETF Capital Markets, PowerShares by Invesco Invesco Canada
Thanks in large part to the popularity of smart beta and factor-based strategies, adoption of exchange-traded funds (ETFs) has grown rapidly in recent years. Some have even speculated that the growth of ETFs is skewing the valuations of certain stocks. I do not believe that is the case. Below, I explain why.
Is the popularity of ETFs affecting single-stock ownership?
ETFs have had a good run of late. Consider these numbers, which cover the five years from April 1, 2012, to March 31, 2017:
- Adoption of ETFs grew by a compound annual rate of 18%1
- Assets under management for U.S.-listed ETFs increased from $1.3 trillion to $2.8 trillion1
- ETF trading volume rose 35%1
- The number of ETFs grew by 20%1
In some quarters, the growth of ETFs has given rise to the notion that ETFs are artificially inflating the valuations of certain stocks. Special attention is being paid to smart-beta strategies, which buy and sell stocks using a disciplined, rules-based methodology. For example, if a value index’s methodology deems a particular stock too expensive, or if a low-volatility index screens out a stock with rising volatility, then ETFs that track these indexes may systematically sell those stocks. (The opposite is true as well: if the metrics of a stock look positive, then that could trigger ETFs to buy it.)
Some market observers argue that the large volume of similar trades at the same times exacerbates herding behavior that can throw stock valuations out of whack. To assess whether or not this is true, it’s important to answer two questions:
- What is the percentage of ETF ownership of single stocks?
- Is this ownership large enough to affect single-stock valuations?
I had my team gather data to address these questions, and they came up with some intriguing results.
Assessing the impact of ETFs
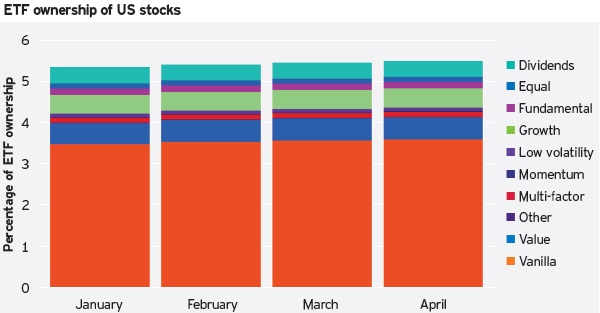
While the percentage of U.S. stocks owned by ETFs has grown, it is still relatively small – too small, in my view, to skew valuations of single stocks. Currently, ETFs own roughly 5.6% of the total U.S. market capitalization, with capitalization-weighted indexes accounting for nearly two-thirds of this total and smart beta ETFs accounting for the balance. This can be seen in the chart below. Market-cap-weighted strategies are depicted as “vanilla,” while all other strategies represent non-market-cap weighted ETFs.


Source: FactSet Research Systems Inc., as of March 31, 2017: includes data from all U.S. ETFs. For illustrative purposes only, and does not represent any of the PowerShares ETFs. ‘Vanilla’ denotes market-cap-weighted ETFs. All other strategies denote non-market-cap-weighted ETFs.
ETF ownership is spread across strategies, with smart-beta concentration levels relatively low
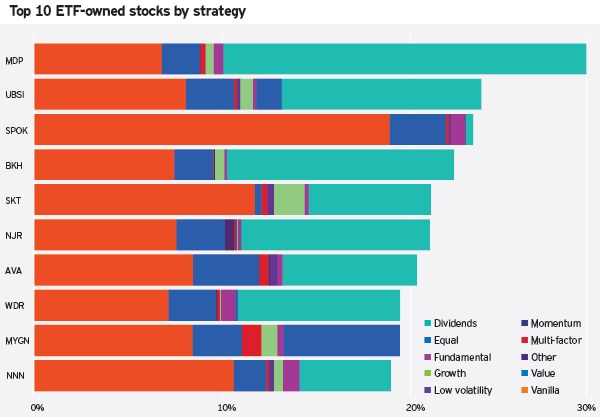
My team also found that while overall ETF ownership of stocks remains low, individual outliers do exist. The chart below shows the 10 U.S. stocks with the highest level of ETF ownership. As you can see, dividends and traditional market-capitalization ETFs make up the bulk of ETFs’ stock ownership, but overall diversification by strategy type remains reasonably high.

Source: FactSet Research Systems Inc., as of March 31, 2017, based on all U.S. ETFs. For illustrative purposes only, and does not represent any of the PowerShares ETFs. Diversification does not guarantee a profit or eliminate the risk of loss. ‘Vanilla’ denotes market-cap-weighted ETFs. All other strategies denote non-market-cap-weighted ETFs.
Large- and small-cap ETF assets largely held in market-cap-weighted strategies
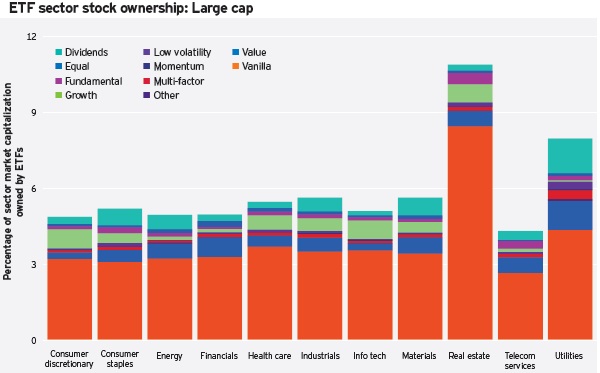
Within large caps, real estate and utilities have the largest ownership by ETFs, with ETFs owning more than 10% of the market capitalization of real estate stocks. Note, however, that most large-cap ETF assets are held in traditional market-capitalization strategies – not smart beta strategies, which have been singled out for swaying equity valuations.

Source: FactSet Research Systems Inc., as of March 31, 2017, based on U.S. large-cap ETFs. For illustrative purposes only, and does not represent any of the PowerShares ETFs. ‘Vanilla’ denotes market-cap-weighted ETFs. All other strategies denote non-market-cap-weighted ETFs.
Among smaller-cap stocks, our research shows that ETFs have a larger ownership footprint. Here again, real estate remains the most concentrated sector, with around 12% of the small-cap real estate market owned by ETFs, followed by utilities and telecommunication services, with about 10% of each sector owned by ETFs. Similar to large-cap utilities, however, traditional market-capitalization strategies account for the bulk of small-cap assets, followed by dividend and value smart beta strategies. This again runs contrary to the theory that a high concentration of smart beta ETF ownership is affecting stock valuations.

Source: FactSet Research Systems Inc., as of March 31, 2017, based on U.S. small-cap ETFs. For illustrative purposes only, and does not represent any of the PowerShares ETFs. ‘Vanilla’ denotes market-cap-weighted ETFs. All other strategies denote non-market-cap-weighted ETFs.
What can we conclude from this data?
- While outliers in a few strategies and sectors shouldn’t be ignored, ETFs own only 5.6% of all U.S. market capitalization, and this ownership is spread broadly across sectors1
- Despite the growth of smart beta, market-cap-weighted strategies still account for the vast majority of ETF ownership. Those ETFs do not have the rules-based mechanisms cited by critics as contributing to herding behavior
Given these facts, I believe it is difficult to argue that smart beta ETFs are having a large effect on stock valuations at this time.
This post was originally published at Invesco Canada Blog
Copyright © Invesco Canada Blog


