
by the Resolve Team, Resolve Asset Management
In this series, we’re going to take a relatively deep dive on the fundamental principles of Adaptive Asset Allocation. The goal is to investigate just how deep the roots of this investing approach go, and provide an intuitive baseline for Global Tactical Asset Allocation strategies in general.
How We’ll Explore Adaptive Asset Allocation
Our process consists of a few basic steps. First, decide on a consistent universe of liquid assets for evaluation. Perhaps surprisingly, selecting the right asset universe for investigation is quite a nuanced proposition, and we plan to discuss it at length later in this series. For now, we provide a brief overview of considerations and define our testing universe.
Next, rank assets by some form of momentum, and hold the strongest assets. We’ll be looking at a wide range of nominal and risk-adjusted momentum metrics to see if any of them stand out. Finally, we must decide how to combine our strongest assets to achieve optimal performance, given specific goals and objectives.
It’s important to keep in mind that any one of these steps is, in and of itself, an entire field of study. Our goal is to find a useful balance between the breadth and depth of each topic, providing actionable intelligence to forward-thinking advisors.
Please note this series is a living thing and will evolve over time. For now, it is our plan to divide the series into five intuitive modules:
- Universe Selection
- Momentum, Part 1: Price
- Momentum, Part 2: Risk-adjusted
- Optimization
- Final Construction
UNIVERSE SELECTION
The universe of assets that is selected for investigation can have a large impact on results and conclusions. With such a dizzying array of instruments to choose from, investors may feel it is prudent to simply include all sufficiently liquid ETFs. However, this approach may produce large unintended biases, which would corrupt our investigation.
To ensure we structure our analysis to focus on the value of active asset allocation decisions with minimal bias, we need clear goal posts. First, our universe should be macro-consistent, which means it must cover the full spectrum of liquid global asset classes, from every major economic region. This ensures that, to the greatest extent possible, we are evaluating a ‘closed system’ of capital allocation, with minimal capital leakage. Perhaps more importantly, it minimizes our susceptibility to survivorship bias, which involves selecting only those assets that have done well enough through history to merit our attention.
Second, our universe should be diverse, and rooted in sound fundamental theory. Specifically, a well-specified universe should have sufficient breadth, including assets whose returns are designed to respond differently to various economic environments. Given that economic growth and inflation surprises are the main fundamental drivers of asset prices, it is essential to include assets that can thrive in any combination of growth and inflation regimes. Figure 1 organizes a representative universe of global asset classes based on how they would be expected to respond to inflation and growth.
Figure 1. The Fundamental Drivers of Asset Returns
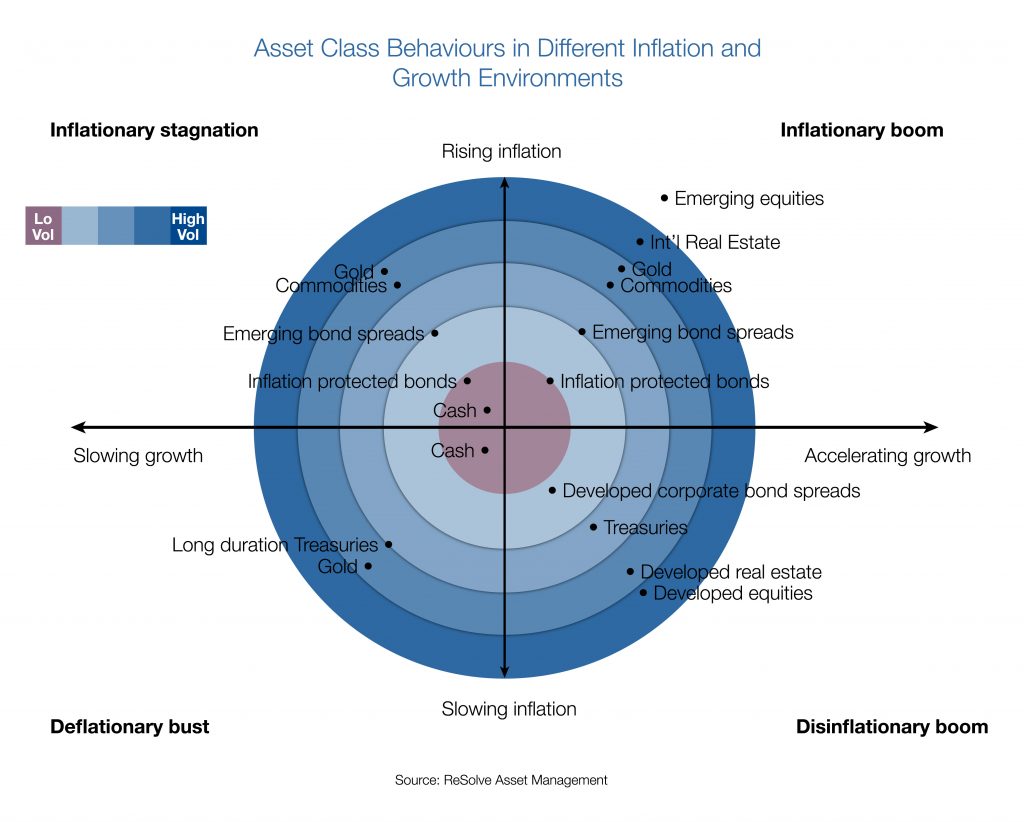 Source: ReSolve Asset Management
Third, while it is critical that all assets and economic regions be represented in our investment universe, the universe must also be free from bias. This means minimizing the potential for overlapping bets. The importance of this step cannot be overstated, and is often overlooked by nascent system developers and major asset managers alike.
To understand why this step is so critical, consider a global tactical manager that, in an effort to broaden his investment universe, decides to include the 50 most liquid U.S. listed ETFs. This universe captures a wide variety of asset classes, including commodities, gold, and global equity and bond markets. However, 37 of these 50 securities (74%) are essentially bets on U.S. equities, differentiated by sectors, smart beta, industries, capitalization, issuer, etc.
Many GTAA strategies involve ranking assets and holding a top fraction, such as the top half of assets. In this case, even if every one of the 13 non-U.S. equity ETFs were to rank in the top half, the strategy would still hold 12 U.S. equity related assets. In other words, even when U.S. stocks are ranked at the bottom, fully 48% (12 of the 25 holdings) of the portfolio’s exposure would be toward U.S. equity beta. If the strategy involves holding the top 1/3 of assets, it would hold a minimum of 4/17 = 24% in U.S. equities. Only a concentrated strategy that holds the top ¼ of assets or less would have the possibility of holding a zero weighting in U.S. stocks. And this would only occur if U.S. equities were ranked at the absolute bottom of all available asset classes.
If it’s still unclear why this is problematic, consider: A poorly-designed investment universe can make it impossible to distinguish between a lucky asset class overweight and a thoughtfully-designed investment strategy. If U.S. stocks comprise most of the investment universe, and they are thriving, even a completely unskilled strategy will also thrive. Conversely, if U.S. stocks suffer, even a highly-skilled strategy will suffer. It is only when the investment universe is well-specified that we can separate the methodological wheat from the chaff.
The current period offers a perfect case study of this phenomenon, as the past decade has been particularly kind to U.S. equities relative to every other major global asset class. In fact, you can see that U.S. stocks have dominated every other asset class in terms of USD total returns over the past 3, 6 and 9 year periods ending February 2017. Obviously, GTAA mandates with investment universes that have been biased toward U.S. equities have had a substantial tailwind over this period. Investors would be forgiven for interpreting the outperformance of these strategies as evidence of skill, where in fact it is an artifact of dumb luck.
Figure 2. Compound Annual USD Total Returns, Periods Ending February 2017
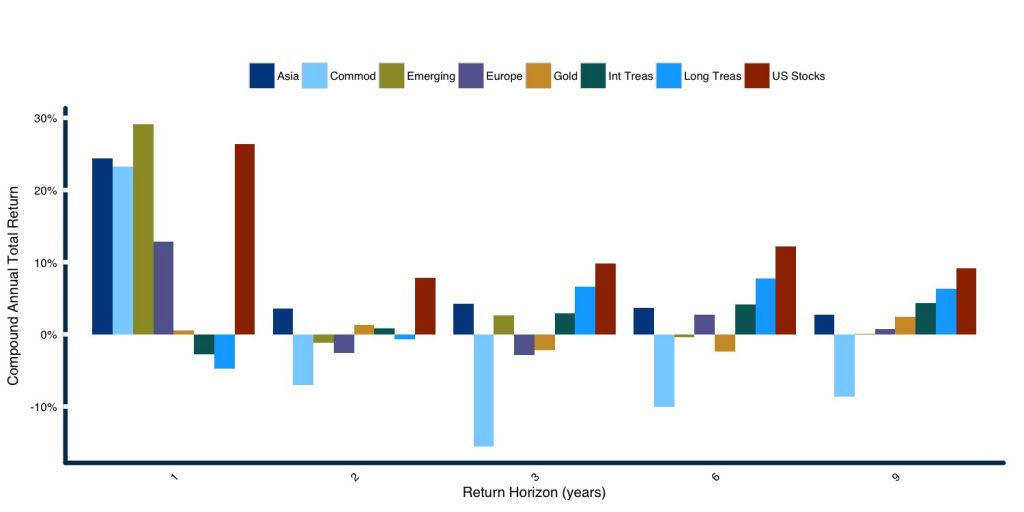 Source: ReSolve Asset Management. Data from CSI.
To summarize, our universe must be representative of the total global investment opportunity set; contain diverse assets that are designed to thrive in different environments of inflation and growth, and finally; avoid multiple instruments that track essentially the same asset class. Now let’s put all three of these objectives into context to select our universe for investigation:
- Commodities (DB Liquid Commodities Index)
- Gold Bullion
- U.S. Stocks (S&P 500)
- European Stocks (FTSE Europe Index)
- Asia Pacific Stocks (MSCI Asia Pacific)
- Emerging Market Stocks (FTSE EM)
- Global REITs (Dow Jones Global REITs Index)
- Intermediate Treasuries (Barclays 7-10 Year Treasury Index)
- Long Treasuries (Barclays 20+ Year Treasury Index)
- Intermediate International Government Bonds (Unhedged)
- USD Denominated Emerging Market Bonds
- Long-Term TIPs
The universe above meets all of our criteria, and covers over 95% of global exchange traded assets.
Note that this universe is slightly different than the universe that we explored in whitepaper. Specifically, we broadened the universe to include international and emerging government bonds, and TIPs. This is more representative of the world’s major asset classes. We also merged U.S. and international REITs into a global REITs index to reflect the fact that REITs are already included in equity indexes, and that they represent a relatively small proportion of liquid global market cap. Finally, we expanded our Asian exposure rather than focusing only on Japan.
It is critical to emphasize that the key words in the label “Global Tactical Asset Allocation” are “asset allocation.” The single greatest explanatory factor of long-term returns is the move from cash into risk assets. That’s why, for our purposes, we want consistent exposure to a diverse basket of risky assets that we expect to deliver excess returns over the long term. That’s why well formulated GTAA strategies are long-only, and why they do not attempt to time assets relative to cash. Market timing ia an excruciatingly challenging exercise for mathematical reasons that we won’t get into here (and several large tactical managers who built a business on this premise learned this the hard way, as every investor must). But we want to emphasize that, done right, GTAA strategies will always be exposed to risky assets. GTAA is about emphasizing those risky assets that are producing their best returns, and de-emphasizing those risky assets that are struggling – in the short term – while maintaining broad exposure to diverse risky assets over the long-term.
The Testing Framework
While the specification of a coherent investment universe is an important first step, there are other dimensions of the problem that must be defined up front. These dimensions are sometimes called “degrees of freedom,” “free parameters,” or “independent variables,” because their specification affects the outcome of our experiments. When we started out on this journey almost 10 years ago, we spent a great deal of time determining which combination of parameters yielded the best historical results. Since then, we’ve realized that this approach is exactly backward. Rather than seeking the narrow set of parameters that offer the best fit of the historical data, we should identify a range of parameters that work well, and use them all. Moreover, by examining the performance over a range of specifications, we gain a more realistic perspective on the likely distribution of future outcomes from the methodology.
Aside from universe specification, we must define the following parameters:
- Lookback windows for signal generation: In practice, we use a large cross-section of multiple lookback samples to form many optimal portfolios at each rebalance. For this series, we will keep it simple by choosing 5 lookback parameters that span the documented momentum region of 1 month to 12 months. We will NOT use a skip-month.
- Number of holdings / portfolio weights: The first few articles in this series deal with methods that sort assets on a momentum criterion, and then hold the top few at each rebalance. More concentrated portfolios have the potential for higher returns, but with greater risk, and vice versa. There are 12 assets in our universe, so we will examine strategies that hold the top 2, 3, 4, and 5 assets. In later tests, we will choose the holdings and weights through optimization, which eliminates this free parameter entirely.
- Holding period / rebalance frequency: Most investigations of time-series analysis examine the performance of systems with monthly rebalance frequency. However, this is just one of a much larger variety of ways that time can be sliced and diced. Given that we are using daily data for our analysis, we are able to examine a variety of rebalancing frequencies, from daily to monthly. Specifically, we run tests using weekly, bi-weekly, tri-weekly and monthly rebalancing frequencies. We test every daily option; so, for weekly rebalancing, we examine weekly trading on the first trading day of the week, second day…fifth day. We run bi-weekly tests on the first trading day, the second day, … 10th day. Thus, we capture the full distribution of rebalancing frequency and timing, and avoid day of the month noise altogether.
There is a possibility that, over our full test horizon, one or two assets might completely dominate the results, by virtue of being especially “trendy” or producing an especially high long-term Sharpe ratio. As a result, we will perform tests on all 79 universe combinations of 10 and 11 assets, along with the full universe. Are you interested what an optimization would look like since 1990 if it didn’t invest in U.S. stocks or U.S. Long-term Treasuries? We’re going to find out. In fact, by the time we’re done, we will have performed 79 universe combinations x 4 number of holdings x 51 different holding periods = 16,116 tests per system.
Corresponding performance metrics will also be provided to illustrate the range of outcomes for each strategy. By performing our tests in this way we gain a much better sense of the true character of each strategy, as well as the class of strategies in general. Prudent system engineers will pay special attention to the lower end of the distribution, as these data points almost certainly provide the greatest clues about what to expect in production.
In our next article, we will begin the task of introducing price momentum as a measurement of strength. We will demonstrate that momentum is persistent and robust, and offer a variety of ways with which to deploy it.
Copyright © Resolve Asset Management