
by Russ Koesterich, Portfolio Manager, Blackrock
Stocks are getting expensive by traditional measures. Russ takes a look at what history tells us about what could happen next.
Despite growing political risk and high valuations, the stock market—like the Energizer Bunny—keeps going and going, grinding upward. I believe that markets can still move higher, and there are good reasons for the ongoing rally—namely, strengthening global growth, and stronger widespread earnings. Still, most traditional valuation ratios indicate that stocks are expensive (particularly in the U.S.) and future returns are likely to be muted.
So where does that leave us going forward? History does provide some interesting insights about how markets perform in the periods when U.S. stocks are expensive—and how investors can think about ways to position their portfolios.
To begin, how expensive are stocks in the U.S.? The current Shiller cyclically adjusted price to earnings (P/E) ratio of the S&P 500 is over 29, well above its long-term average of around 17. But to put that number in perspective, the same measure was in the 40s during the dotcom bubble and has exceeded 30 less than 4% of its entire history going back to 1881. Other valuation metrics tell a similar story: Stocks are expensive, although it is not clear that they are yet in bubble territory. The lights are arguably flashing yellow, but certainly not red. It is also worth remembering that value is a poor short-term indicator of market performance.
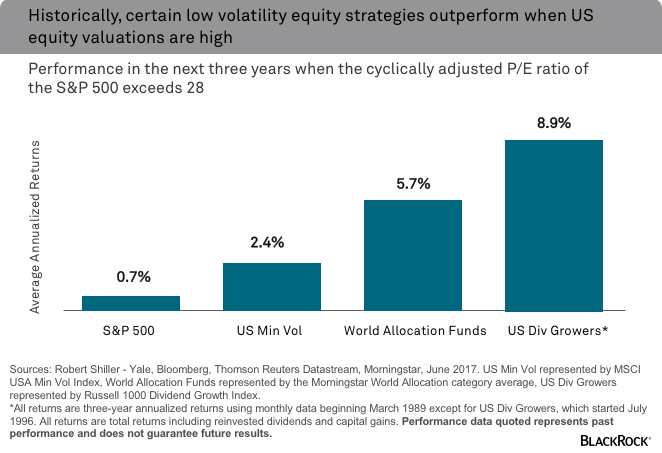
Still, historically, when valuations have been at these levels, performance in the next few years has been significantly lower. When the cyclically adjusted P/E of the S&P 500 has been greater than 28, average annual returns over the next three years has only been 0.7%. In short, while the outlook for U.S. stocks is hardly bleak, investors should expect significantly lower returns over the next few years than what they have become accustomed to in recent years.
Having said that, there are areas of the market that have outperformed the S&P 500 in relatively expensive markets. As the figure below illustrates, minimum volatility strategies, particularly dividend growers, and broader world allocation strategies all outperform the S&P 500 in periods when the cyclically adjusted P/E ratio exceeds 28.
Since the end of the financial crisis and the beginning of the current bull market, the market environment has been unique. Significant easing by global central banks, historically low yields, sluggish economic growth, demographic factors—all have resulted in a market environment unlikely any seen in decades (if ever).
In short, no one can be sure how various asset classes will perform, if or when the current bull market loses steam. But it is unlikely the broader S&P 500 will continue to be the workhorse it has been in the recent past, and being more selective will be key going forward.
For example, strategies that look for growth with a broader mandate and that thoughtfully manage risk will play an important role. This is for several reasons: First, such strategies can build portfolios from the bottom up and therefore be very granular when gaining exposure to various markets (and avoid the more egregiously overvalued parts of the market.)
In addition, these strategies can shift between regions. Today, for example, emerging markets, Europe and Japan all look more reasonably priced than the U.S. All of these factors suggest a more effective approach toward navigating the current period of high valuations.
Russ Koesterich, CFA, is Portfolio Manager for BlackRock’s Global Allocation team and is a regular contributor to The Blog.
Investing involves risks, including possible loss of principal. International investing involves special risks including, but not limited to currency fluctuations, illiquidity and volatility. These risks may be heightened for investments in emerging markets.
This material is not intended to be relied upon as a forecast, research or investment advice, and is not a recommendation, offer or solicitation to buy or sell any securities or to adopt any investment strategy. The opinions expressed are as of July 2017 and may change as subsequent conditions vary. The information and opinions contained in this post are derived from proprietary and nonproprietary sources deemed by BlackRock to be reliable, are not necessarily all-inclusive and are not guaranteed as to accuracy. As such, no warranty of accuracy or reliability is given and no responsibility arising in any other way for errors and omissions (including responsibility to any person by reason of negligence) is accepted by BlackRock, its officers, employees or agents. This post may contain “forward-looking” information that is not purely historical in nature. Such information may include, among other things, projections and forecasts. There is no guarantee that any forecasts made will come to pass. Reliance upon information in this post is at the sole discretion of the reader. Past performance is no guarantee of future results.
©2017 BlackRock, Inc. All rights reserved. BLACKROCK is a registered trademark of BlackRock, Inc., or its subsidiaries in the United States and elsewhere. All other marks are the property of their respective owners.
Copyright © Blackrock