


by Lance Roberts, Clarity Financial
Over the years, I have regularly addressed the psychological and emotional pitfalls which ultimately lead individual investors to poor outcomes. The internet is regularly littered with a stream of articles promoting the ideas of “dollar cost averaging,” “buy and hold” investing, and “passive indexing” as the solution to achieving your financial dreams.
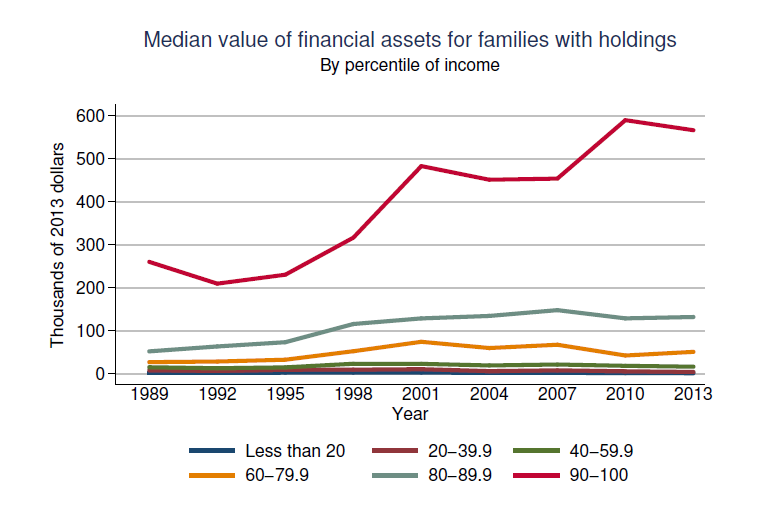
However, as I addressed in the “Illusion Of Declining Debt To Income,” if this was truly the case, then why is the majority of Americans so financially poor?
But here are some stats from a recent Motley Fool survey:
“Imagine how the 50th percentile of those ages 35 – 44 has a household net worth of just $35,000 – and that figure includes everything they own, any equity in their homes, and their retirement savings to boot.
That’s sad considering those ages 35 and older have had probably been out in the workforce for at least ten years at this point.
And even the 50th percentile of those ages 65+ aren’t doing much better; they’ve got a median net worth of around $171,135, and quite possibly decades of retirement ahead of them.
How do you think that is going to work out?”
So, what happened?
- Why aren’t those 401k balances brimming over with wealth?
- Why aren’t those personal E*Trade and Schwab accounts bursting at the seams?
- Why isn’t there a yacht in every driveway and a Ferrari in every garage?
It’s because investing does NOT WORK they way are you told. (Read the primer “The Big Lie”)
Here are the 7-Myths you are told that keep you from being a successful investor.
The 7-Myths Of Investing
1) You Can’t Time The Market
Now, let me be clear. I am NOT discussing “market timing” which is specifically being “all in” or “all out” of the market at any given time. The problem with trying to “time” the market is “consistency.”
What I am discussing is “risk” management which is the minimization of losses when things go wrong. While there are many sophisticated methods of handling risk within a portfolio, even using a basic method of price analysis, such as a moving average crossover, can be a valuable tool over long-term holding periods.
The chart below shows a simple moving average crossover study. The actual moving averages used are not important, but what is clear is that using a basic form of price movement analysis can provide a useful identification of periods when portfolio risk should be REDUCED. Importantly, I did not say risk should be eliminated; just reduced.
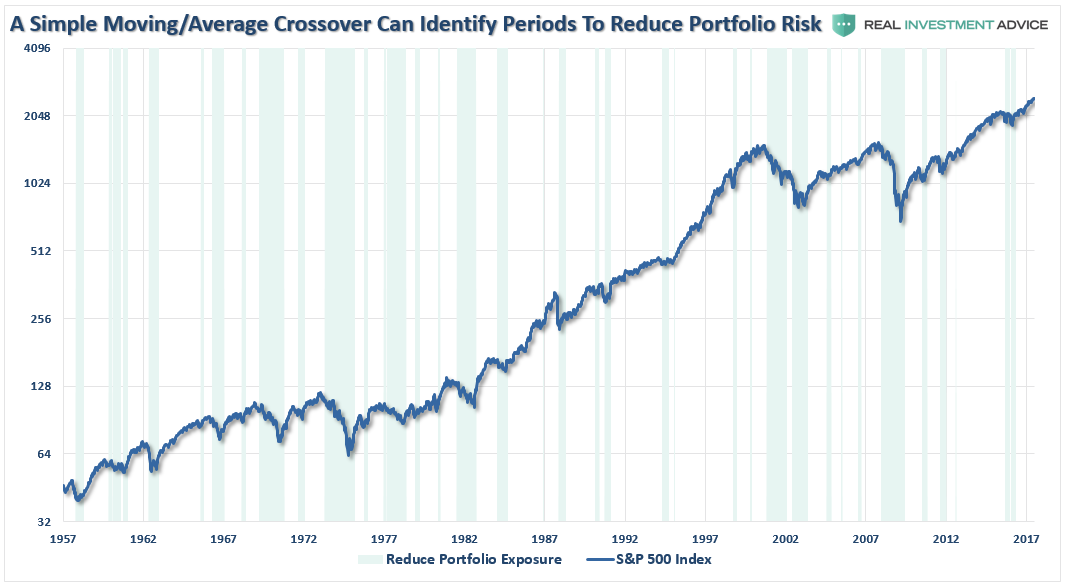
Again, I am not implying, suggesting or stating that such signals mean going 100% to cash. What I am suggesting is that when “sell signals” are given, it is the time when individuals should perform some basic portfolio risk management.
Using some measure, any measure, of fundamental or technical analysis to reduce portfolio risk as prices/valuations rise, the long-term results of avoiding periods of severe capital loss will outweigh missed short term gains. Small adjustments can have a significant impact over the long run.
2) “Buy and Hold” & “Dollar Cost Average”
While these two mantras have been the “core” of Wall Street’s annuitization and commoditization of the investing business by turning volatile commission revenue into a smooth stream of income, it has clearly not actually worked for the investors that were sold the “scheme.” To two biggest reasons for the shortfalls was:
1) the destruction of investor capital, and;
2) investor psychology.
Despite the logic behind “buying and holding” stocks over the long term, the biggest single impediment to the success over time is psychology. Behavioral biases that lead to poor investment decision-making is the single largest contributor to underperformance over time. Dalbar defined nine of the irrational investment behavior biases but the two biggest of these problems for individuals is the “herding effect” and “loss aversion.”
These two behaviors tend to function together compounding the issues of investor mistakes over time. As markets are rising, individuals are lead to believe that the current price trend will continue to last for an indefinite period. The longer the rising trend last, the more ingrained the belief becomes until the last of “holdouts” finally “buys in” as the financial markets evolve into a “euphoric state.”

As the markets decline, there is a slow realization that “this decline” is something more than a “buy the dip” opportunity. As losses mount, the anxiety of loss begins to mount until individuals seek to “avert further loss” by selling.
This behavioral trend runs counter-intuitive to the “buy low/sell high” investment rule and continually leads to poor investment returns over time.
3) More Risk = More Return:
The next “myth” is one that is too often uttered. Investors are continually prodded to take on additional exposure to equities to gain the potential for higher rates of return if everything goes right. What is never discussed, is what happens when everything goes wrong?
If you look up the definition of “risk,” it is “to expose something of value to danger or loss.”
As my partner Michael Lebowitz noted:
“When one assesses risk and return, the most important question to ask is ‘Do my expectations for a return on this investment properly compensate me for the risk of loss?’ For many of the best investors, the main concern is not the potential return but the probability and size of a loss.
No one has a crystal ball that allows them to see into the future. As such the best tools we have are those which allow for common sense and analytical rigor applied to historical data. Due to the wide range of potential outcomes, studying numerous historical periods is advisable to gain an appreciation for the spectrum of risk to which an investor may be exposed. This approach does not assume the past will conform to a specific period such as the last month, the past few years or even the past few decades. It does, however, reveal durable patterns of risk and reward based upon valuations, economic conditions, and geopolitical dynamics. Armed with an appreciation for how risk evolves, investors can then give appropriate consideration to the probability of potential loss.”
Spending your investment time horizon making up previous losses is not an optimal strategy to build wealth.
4) All The “Cash On The Sidelines” Will Push Prices Higher
How often have we heard this? I busted this myth in detail in “Liquidity Drain” but here is the main point:
Clifford Asness previously wrote:
“There are no sidelines. Those saying this seem to envision a seller of stocks moving her money to cash and awaiting a chance to return. But they always ignore that this seller sold to somebody, who presumably moved a precisely equal amount of cash off the sidelines.”
Every transaction in the market requires both a buyer and a seller with the only differentiating factor being at what PRICE the transaction occurs. Since this must be the case for there to be equilibrium to the markets there can be no “sidelines.”
Furthermore, despite this very salient point, a look at the stock-to-cash ratios also suggest there is very little available buying power for investors current.

There is no cash on the sidelines.
5) Tax Cuts Will Fuel The Markets
We are told repeatedly that “cutting taxes” will lead to a massive acceleration in economic growth and a boom in earnings. However, as Dr. Lacy Hunt recently discussed, this may not be the case.
“Considering the current public and private debt overhang, tax reductions are not likely to be as successful as the much larger tax cuts were for Presidents Ronald Reagan and George W. Bush. Gross federal debt now stands at 105.5% of GDP, compared with 31.7% and 57.0%, respectively, when the 1981 and 2002 tax laws were implemented. Additionally, tax reductions work slowly, with only 50% of the impact registering within a year and a half after the tax changes are enacted. Thus, while the economy is waiting for increased revenues from faster growth from the tax cuts, surging federal debt is likely to continue to drive U.S. aggregate indebtedness higher, further restraining economic growth.
However, if the household and corporate tax reductions and infrastructure tax credits proposed are not financed by other budget offsets, history suggests they will be met with little or no success. The test case is Japan. In implementing tax cuts and massive infrastructure spending, Japanese government debt exploded from 68.9% of GDP in 1997 to 198.0% in the third quarter of 2016. Over that period nominal GDP in Japan has remained roughly unchanged. Additionally, when Japan began these debt experiments, the global economy was far stronger than it is currently, thus Japan was supported by external conditions to a far greater degree than the U.S. would be in present circumstances.”
The outcome of tax reform/cuts at the tail end of an economic expansion may have much more muted effects than the market has currently already “priced in.”
6) Cash Is For Losers:
Investors are often told that holding cash is fooling. Not only are you supposedly “missing out” on the rocketing “bull market” but you cash is being dwindled away by “inflation.” The problem is, and as I will discuss in a second, is the outcome of taking “cash” and investing that cash into the second most overvalued market in history.
As I discussed in the “Real Value Of Cash:”
The chart below shows the inflation-adjusted return of $100 invested in the S&P 500 (capital appreciation only using data provided by Dr. Robert Shiller). The chart also shows Dr. Shiller’s CAPE ratio. However, I have capped the CAPE ratio at 23x earnings which has historically been the peak of secular bull markets in the past. Lastly, I calculated a simple cash/stock switching model which buys stocks at a CAPE ratio of 6x or less and moves back to cash at a ratio of 23x.
I have adjusted the value of holding cash for the annual inflation rate which is why during the sharp rise in inflation in the 1970’s there is a downward slope in the value of cash. However, while the value of cash is adjusted for purchasing power in terms of acquiring goods or services in the future, the impact of inflation on cash as an asset with respect to reinvestment may be different since asset prices are negatively impacted by spiking inflation. In such an event, cash gains purchasing power parity in the future if assets prices fall more than inflation rises.

While cash DID lose relative purchasing power, due to inflation, the benefits of having capital to invest at lower valuations produced substantial outperformance over waiting for previously destroyed investment capital to recover.
Much of the mainstream media will quickly disagree with the concept of holding cash and tout long-term returns as the reason to just remain invested in both good times and bad. The problem is it is YOUR money at risk and most individuals lack the “time” necessary to truly capture 30 to 60-year return averages.
7) If You’re Not “In,” You Are Missing Out:
As discussed with respect to “holding cash,” periods of low returns have always followed periods of excessive market valuations. In other words, it is vital to understand the “WHEN” you begin investing that affects your eventual outcome.
The chart below compares Shiller’s 20-year CAPE to 20-year actual forward returns from the S&P 500.
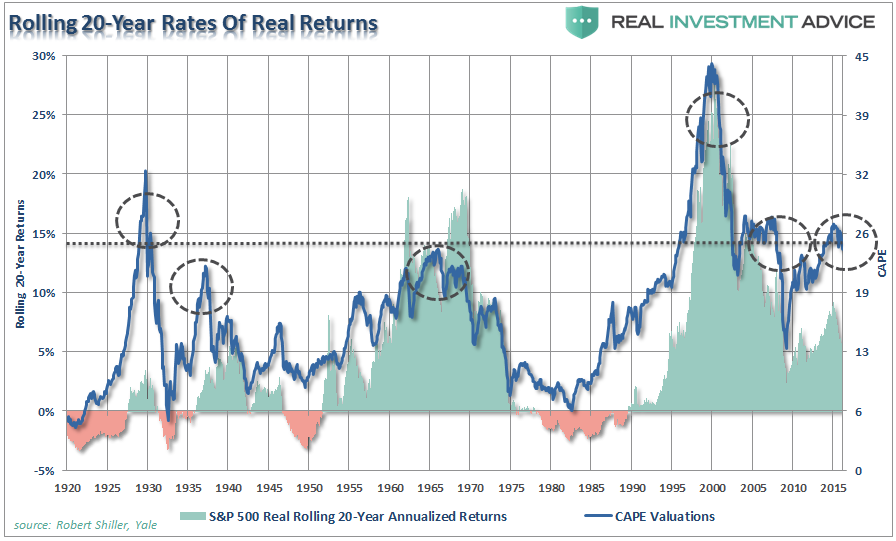
From current levels, history suggests returns to investors over the next 20-years will likely be lower than higher.
The Truth
No one can rely on these “myths” for their financial future.
Again, if the “myths” above weren’t “myths,” wouldn’t there be a whole lot of rich people heading into retirement.
In the end, only three things really matter in investing for the “long-term:”
- The price you pay.
- When you sell, and;
- The “risk” you take.
Get any one of those three things wrong, and your outcome will be far less than you have been promised by Wall Street.
Copyright © Clarity Financial