


by Lance Roberts, Clarity Financial
On Monday, the market was open for a half-day preceding the “Independence Day” holiday, and with the majority of the “human element” on vacation, the markets surged as the “robots” kicked in to “buy the recent dip.”
As I noted in this past weekend’s missive:
“As noted on Friday, the last couple of weeks have experienced a sharp rise in price volatility. While stocks have vacillated in a very tight 1.5% trading range since the beginning of June, there has been little forward progress to speak of. However, notice that support at 2416 has remained solid as ‘robots’ continue to execute their program of ‘buying the dips.’”
Of course, the problem is what happens when these algorithms begin to reverse and “sell the rallies?”
That is the question I want to explore today which is simply: “how big of a correction is coming?”
For the purpose of this exercise, we will look at the S&P 500 Index as the proxy for the markets and use a Fibonacci retracement measure on a daily, weekly and monthly basis spanning various time frames in the market. The analysis will be run using, for each time frame, the most important previous support levels as the starting point.
A quick explanation on Fibonacci retracements in case you are unfamiliar from StockCharts.com:
“Fibonacci Retracements are ratios used to identify potential reversal levels. These ratios are found in the Fibonacci sequence. The most popular Fibonacci Retracements are 61.8% and 38.2%. Note that 38.2% is often rounded to 38% and 61.8 is rounded to 62%. After an advance, chartists apply Fibonacci ratios to define retracement levels and forecast the extent of a correction or pullback.“
Click the link above if you want more detail.
Daily
On a daily price basis, which is more important for shorter term holding periods, the bottoms in 2014 and 2016 provide the strongest base of price support from which to calculate retracement levels.
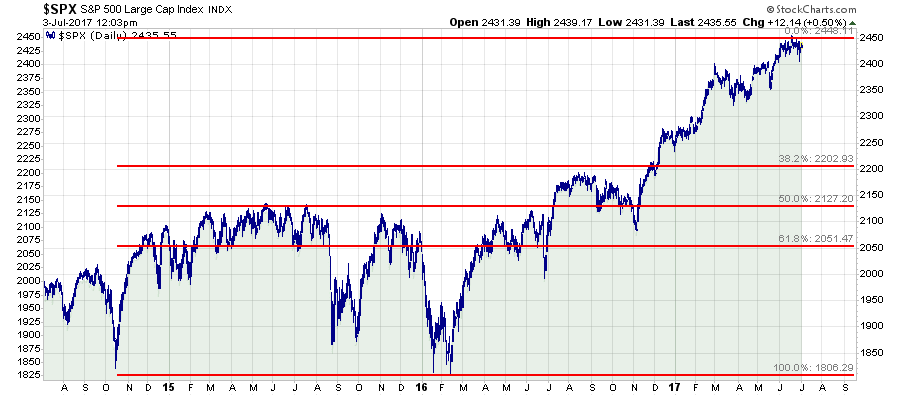
A correction to each potential support level would be as follows:
38.2% Retracement = 10.04%
50.0% Retracement = 13.07%
61.8% Retracement = 16.18%
100% Retracement = 26.14% (Official Bear Market)
As noted, it would currently require a loss of nearly 500 points on the S&P 500 just to officially enter bear market territory from current levels. As discussed yesterday, such a negative impact to portfolios should not be lightly dismissed.
A correction of this magnitude would wipe out all the gains in portfolios since 2014 erasing 3-years of advancement towards financial goals.
Assuming a 6% annual rate of return it would require an additional 4-years to get back to even effectively destroying 7-years of an investor’s time horizon.
Weekly
If we expand our time frame to weekly, the picture changes somewhat. In the following example, the prior market peaks of 2000 and 2008 become critical support for the markets.
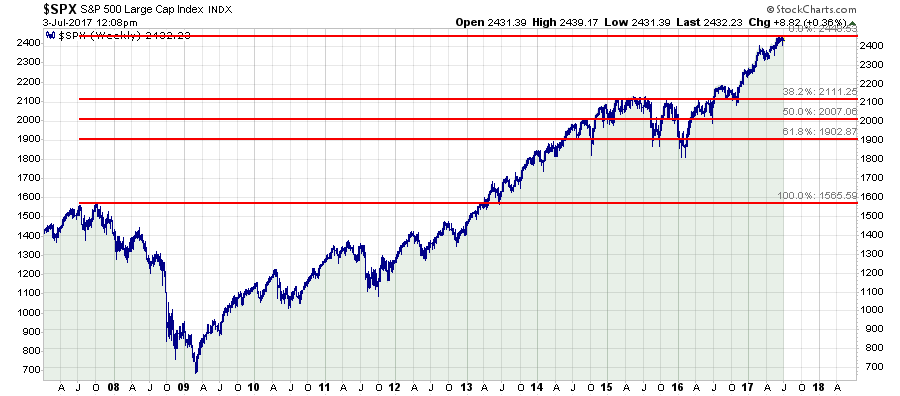
A correction to each potential support level would be as follows:
38.2% Retracement = 13.82%
50.0% Retracement = 18.14%
61.8% Retracement = 22.24% (Official Bear Market)
100% Retracement = 36.06% (Average Correction During Recessions)
Don’t dismiss the weekly retracement to previous market peaks. A retracement of 36.06%, as noted, is coincident with the onset of a recessionary drag in the economy. Given the current economic expansion is now the second longest in history, at the lowest rate of annual growth, this is a rising risk to longer-term investors.
A correction of this magnitude would wipe out all the gains in portfolios since 2013 erasing 4-years of advancement towards financial goals.
Assuming a 6% annual rate of return it would require an additional 8-years to get back to even effectively destroying 12-years of an investors total time horizon.
Monthly
If we step out further using monthly price data, the longer-term investing picture for investors looks exceedingly more risky.
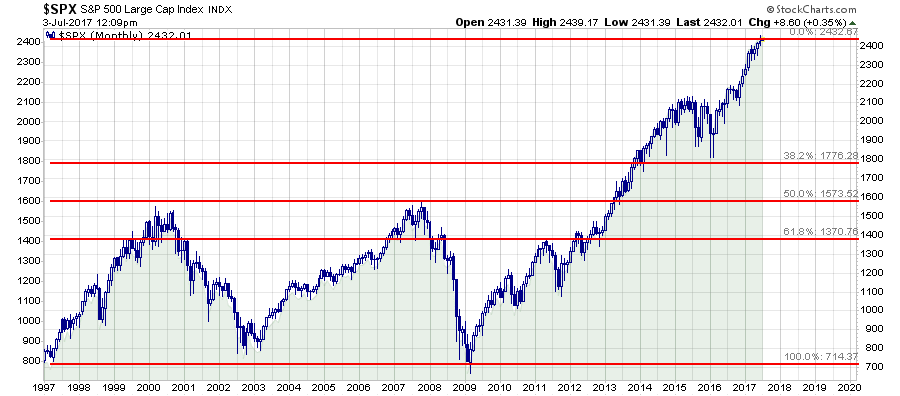
A correction to each potential support level would be as follows:
38.2% Retracement = 26.57% (Official Bear Market)
50.0% Retracement = 35.29% (Average Correction During A Recession)
61.8% Retracement = 43.56% (Less Than The Financial Crisis & Dot.com Busts)
100% Retracement = 70.57% (Welcome To The “Great Depression 2.0)
When looking at monthly data, we get the clearest picture of the risk related to each potential phase of a correction. As noted above, a correction to the first retracement level would in actuality be little more than a normal bear market within an ongoing bull market trend.
A 50% retracement would be normal for a recessionary contraction. Even a 61.8% retracement would be “less worse” than what was seen during the previous two bear markets.
Even the most outlandish correction back to previous bear market lows would be LESS THAN the 85% correction witnessed by the Dow following the 1929 peak.
My point is that none of the possibilities should be readily dismissed. They have all happened before and some with more regularity than others.
Here is the important point for each correction level noted above if we assume you are expecting 6% annual rates of return and have a finite time to reach your retirement goals.
A 26.57% correction resets portfolios back to 2014 and requires almost 6-years to get back to even. Total time horizon destroyed is 9-years.
A 35.29% correction resets portfolios back to 2000 and requires almost 8-years to get back to even. Total time horizon destroyed is 25-years.
A 43.56% correction resets portfolios back to 1999 and requires almost 10-years to get back to even. Total time horizon destroyed is 28-years.
A 70.57% correction resets portfolios back to 1997 and requires 21-years to get back to even. Total time horizon destroyed is 42-years.
Conclusion
While some of these corrections MAY seem outlandish to you currently, giving the current exuberance in the markets, they have all occurred at one point or another in the past. Usually, such corrections have generally occurred at about the same juncture where the majority of investors had come to embrace the “this time is different” mantra.
I am not suggesting that any of the above corrections will happen tomorrow, next month or even this year. But I am stating that a correction will come. The analysis above simply tries to assess the magnitude of such a correction AND the consequences of not “managing risk” in your portfolio.
While the idea of “buying and holding” and “robot driven” allocations is certainly appealing in a seemingly “can’t lose” market, the problem for investors is “when” they occur.
Time is the most precious commodity ANY investor has. Disregarding the impact of time horizons when managing your investments can have very negative consequences.
Just remember, in the market there really isn’t such a thing as “bulls” and “bears.” However, there are those that “succeed” in reaching their investing goals and those that “fail.”
Copyright © Clarity Financial