by Ryan Detrick, LPL Research
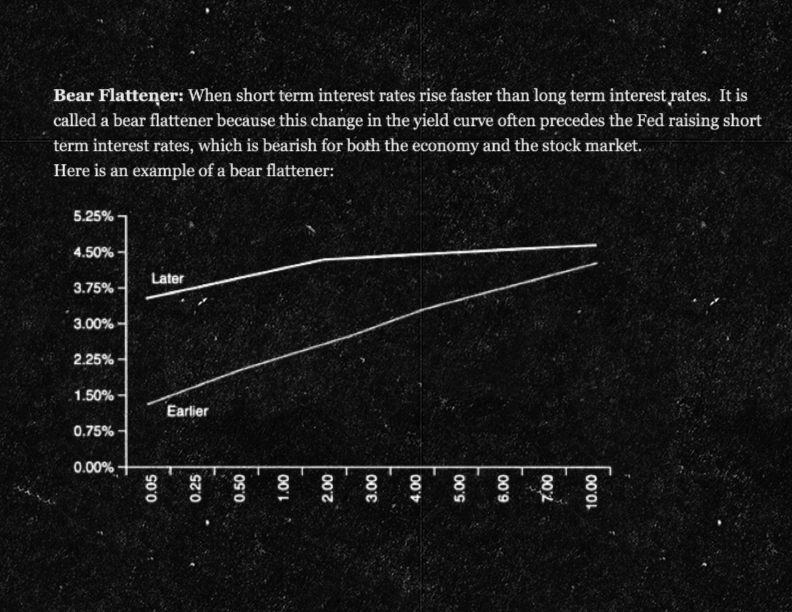
The flattening of the yield curve has gained a lot of attention recently, but why does it matter? The Treasury yield curve, shown below, is a graphical representation of yields on Treasury securities across a range of maturities. The difference between long-term yields, which are driven largely by longer-term growth and inflation expectations, and short-term yields, which are more heavily impacted by Fed policy, is referred to as the steepness of the yield curve. A steepening yield curve, where long-term rates are moving higher relative to short-term rates, is often viewed as a good omen for future economic growth as it may signal that investors expect economic growth to increase in the future. On the other hand, a flattening yield curve, like the one we have seen in recent months, could make investors nervous as it may imply more pessimistic expectations for future growth.
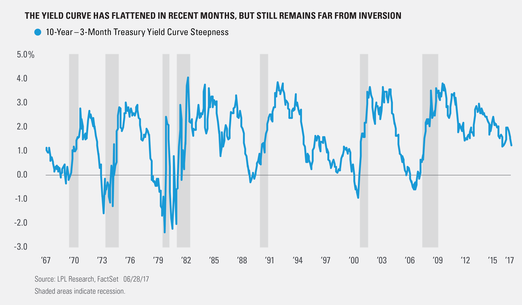
Part of the reason that some investors don’t like to see a flattening yield curve is that an inverted yield curve (where longer-term rates become lower than short-term rates) has a good track record of forecasting recessions. Each of the seven recessions over the past 50 years was preceded by the Fed hiking short-term rates enough to invert the yield curve (as measured by the difference between 10-year and 3-month Treasury securities). The yield curve inversion usually takes place about 12 months before the start of the recession, but the lead time has ranged from about 5–16 months. The peak in the stock market has usually come around the time of the yield curve inversion, that is, ahead of the recession and accompanying downturn in corporate profits.
While an inverted curve has been a good historic indicator of an upcoming recession, a flattening curve has not. Though the curve has flattened in recent months back to pre-election levels, it still has a long way to go (more than 1.20%) before inverting.
Although the yield curve has flattened, we see little stress evident in areas of the bond market that have historically been good indicators of increased potential for economic and/or geopolitical risk (such as spreads between yields on Treasuries and investment-grade or high-yield corporate bonds). Nonetheless, the possibility of higher rates of economic growth and inflation, along with the potential for one additional Fed rate hike in 2017 (totaling three for the year) may put bond prices under pressure moving forward. As we note in our recently released Midyear Outlook 2017: A Shift in Market Control, we expect the 10-year Treasury yield to end 2017 in the 2.25%–2.75% range, with the potential for moves toward 3.0% should anticipated policy support lead to a meaningful rise in economic activity.
Take a look at the publication for more in-depth insights on the economy, stock and bond markets, and investments through year-end.
*****
IMPORTANT DISCLOSURES
Past performance is no guarantee of future results. All indexes are unmanaged and cannot be invested into directly.
The opinions voiced in this material are for general information only and are not intended to provide or be construed as providing specific investment advice or recommendations for any individual security.
The economic forecasts set forth in the presentation may not develop as predicted.
Bonds are subject to market and interest rate risk if sold prior to maturity. Bond values and yields will decline as interest rates rise, and bonds are subject to availability and change in price.
Government bonds and Treasury bills are guaranteed by the U.S. government as to the timely payment of principal and interest and, if held to maturity, offer a fixed rate of return and fixed principal value. However, the value of fund shares is not guaranteed and will fluctuate.
This research material has been prepared by LPL Financial LLC.
To the extent you are receiving investment advice from a separately registered independent investment advisor, please note that LPL Financial LLC is not an affiliate of and makes no representation with respect to such entity.
Not FDIC/NCUA Insured | Not Bank/Credit Union Guaranteed | May Lose Value | Not Guaranteed by any Government Agency | Not a Bank/Credit Union Deposit
Securities and Advisory services offered through LPL Financial LLC, a Registered Investment Advisor Member FINRA/SIPC
Tracking #1-598711 (Exp. 06/18)
Copyright © LPL Research


