The Active versus Passive Performance Debate Is Nonsensical
by Chuck Carnevale, F.A.S.T. Graphs
One of the most hotly contested debates in finance is the argument over which is better – active or passive investing. Moreover, this debate has spurred numerous academic studies that claim to identify whether passive outperforms active investing or vice versa. As a result, the current popular opinion suggests that passive outperforms active investing the majority of the time. However, the percentages can vary by a significant degree depending on who’s performing the study. Personally, I have seen numbers such as 85%, 91% and perhaps more commonly some will just say that the majority of actively managed funds fail to beat passively managed or index funds.
On the other hand, what I have yet to see is a clear definition of what an actively managed fund or portfolio really is. This has always been my biggest issue with these academic studies. The concept of passive is often more clearly defined as an index fund or portfolio. In other words, passive management is comprised of portfolios that mirror or match an index such as the S&P 500, etc. However, I have yet to see a clear definition of what constitutes or defines active management. Nevertheless, based on these criteria, I can only assume that any fund or portfolio that is not index based is included in the active management universe.
So my question is; how do you define active? Is it based on the amount of turnover in the portfolio, and if so, does every active manager in the studies have the same level of turnover? What strategies are being employed? Are all the active managers investing for growth, income or a combination of both? It seems to be clear what passive strategies are comprised of, but it is very unclear as to how the active category is defined.
But perhaps even more relevant to my skepticism is the implicit assumption that there are only 2 kinds of investing strategies-passive or active. Furthermore, these terms would also suggest that portfolio turnover or activity is the key differentiating factor. This really confuses me because even an index fund like the S&P 500 has turnover. In other words, stocks regularly come into and leave the index. Therefore, even an index fund has activity. So my question is; is there an activity or turnover standard or threshold that defines a portfolio as active? Furthermore, are these studies suggesting that any portfolio that is not an index has high turnover?
Therefore, one question I have, among many, would be; does a buy-and-hold long-term investing strategy fall into the active side or the passive side of the debate? For example, if an investor builds a portfolio of let’s say 30 stocks and never sells any of them, is that investor considered an active investor or a passive investor? Believe it or not, I have known investors that have done precisely that. They have bought and held stocks for decades.
And even more to the point is the undeniable reality that there are numerous investing strategies and many of them are not designed to beat the market. Instead, and for example, there are strategies designed to produce income, there are strategies designed to mitigate risk and there are strategies designed to meet specific investor objectives – and many more. Therefore, I consider the raging debate of active versus passive investing nonsensical. Attempting to define the broad universe of investing strategies as either active or passive is simply too restrictive and/or general to be of any real value.
How Do You Measure Performance and Should You Care Whether Active Beats Passive Investing?
Furthermore, where is it written that as an investor I should have the singular goal of beating the overall stock market on a total return basis? What if I need more income than the S&P 500 index is capable of generating for me? Therefore, if I build a stock portfolio that produces significantly more dividend income than the S&P 500, have I somehow failed as an investor because my capital appreciation component may be lower? Personally, I think not.
Moreover, if I am judging my success or failure based on outperforming a benchmark such as the S&P 500 on a total return basis, this could prove problematic to my goals and objectives. The problem with total return investing is that I become subject to the vagaries of short-term price action. As an income investor it is possible that I would be forced to harvest shares during a bad market in order to meet my income needs. Therefore, I would be invading my principal and doing it at a time when I might be better served to simply hold. But since I need current income, invading my principal is really not a viable option.
In contrast, if I have built a dividend growth portfolio that is producing an adequate amount of dividend income to meet my needs, short-term price volatility is of no consequence. For starters, short-term price volatility is very unpredictable and could work against me. However, since my dividend income stream is based on the number of shares I own, it is also more predictable and reliable regardless of what the market may be doing on a short-term price action basis. In other words, even when the market price of my stock is falling, my dividend income can actually be rising, assuming I picked the right dividend growth stocks.
Additionally, there is always the question of valuation, or perhaps more precisely – relative valuation. For example, if the overall market has produced strong results but is simultaneously significantly overvalued, should I really be happy about that? My current returns, if I was an index investor, might be quite good, but at the same time I could be facing significant future risk. Good returns in that scenario might lead me into a place of dangerous complacency. In other words, I could be feeling very happy even though I might be facing pending financial disaster when valuations correct.
Stated differently, what I’m referring to at this point is risk. Investing in the index at high valuation, which is where I believe we are today, would essentially be taking on more risk than I am comfortable with even though recent returns have been exceptional. Which leads me to my most favorite idiom that I personally coined: “measuring performance without simultaneously measuring valuation is a job half done.” Unlike a lot of investors, I get nervous when my performance is good primarily because valuations have become excessive. High valuations might have produced excellent short-term results, but they are also producing significantly higher risk at the same time.
Conflicting Studies on Passive Versus Active Investing
Although many people hold the view that the active versus passive investing records are conclusive, I have found that the records are anything but. Here is a link to an INVESTOPEDIA report that suggests that performance results can vary significantly depending on the timeframe and other factors. To me this simply further suggests that the results are anything but indisputably conclusive.
The Most Predictable Ways To Outperform The S&P 500
I believe that one of the more predictable ways to outperform the S&P 500, or any other index, is to behave as the S&P 500 behaves. However, I am not suggesting becoming what some refer to as a closet indexer. Instead, I am suggesting that you do a couple of very simple things.
First and foremost, I suggest that you keep trading activity at a minimum. Although, as I previously mentioned, every index does have some activity where stocks enter and leave the index. However, this is usually the limit to transactions. Succinctly stated, if you want to perform as well or better than an index, keep your turnover low. Every time you make an investment decision you expose yourself to being wrong as much as you do to being right. Therefore, I believe you are better served by making a few well-researched good decisions than by making a lot of impetuous moves.
This leads me to my second simple thing, if you are endeavoring to be better than average, then limit your investments to above-average companies. In this regard, I am not talking about price performance. Instead, I’m talking about identifying companies that have produced operating results that are above the average of the S&P 500. And then, and I consider this the most important part, be careful to only invest in these above-average companies when their valuations make sound economic sense.
Although this seems simple, it is also extremely challenging for many to implement. It takes patience, and a certain amount of research and due diligence, coupled with constant monitoring. But once again, not price monitoring, but monitoring the fundamental strength and success of the businesses you have chosen.
The above strategy is one strategy that I believe is capable of outperforming the market over the long term, but it is certainly not the only way. Personally, there is a strategy that I am currently implementing that is almost certain to outperform the market in a very strategic manner. Generically it is commonly referred to as dividend growth investing. However, my personal approach has its own nuances as follows.
My personal objective is for maximum current income at reasonable levels of risk. Therefore, I am searching for fairly valued dividend growth stocks with above-market current yields. Importantly, finding blue-chip dividend growth stocks at sound valuations is challenging in today’s market. However, that is not to say it is impossible. Nevertheless, the rewards are very predictable, and to my way of thinking – very calming.
However, since this article is discussing beating the market, I believe this strategy beats the market in precisely the way that is most relevant to my objectives. Stated more simply, I look for companies that are producing dividend yields higher than the market with companies that have long histories of increasing their dividends over sustained periods of time. The simple strategy virtually assures me that I will generate more spendable income than the index is capable of providing. Consequently, I am position to currently, and in the future, outperform the S&P 500 on a total dividend income basis.
However, I have also experienced a very interesting side effect that often occurs over the long run. In the majority of cases, if I’m investing in above-average yielding stocks, and I am careful to buy them when valuation is sound, I might even beat the S&P 500 on a total return basis as well. Maybe not over the short run, and maybe not over every timeframe, but in the long run my total returns can be quite attractive.
So before I provide a few examples, let me summarize the benefits of investing in dividend growth stocks at sound valuations. Total return is calculated based on two components – growth and income. Since my strategy is to invest in above-average yielding companies, I am close to certain of beating the S&P 500 on a total income basis. But best of all, since current income is my primary objective, I have already won.
The growth or capital appreciation component will be a function of the growth of the business I invest in relative to the valuation I pay to buy it. If I have done this part even reasonably well, I’m almost certain to receive some amount of growth or capital appreciation over the long run. Therefore, I am also reasonably certain that my investment might also compete with the S&P 500 reasonably well on a total return basis as well.
Real-world Examples via F.A.S.T. Graphs™
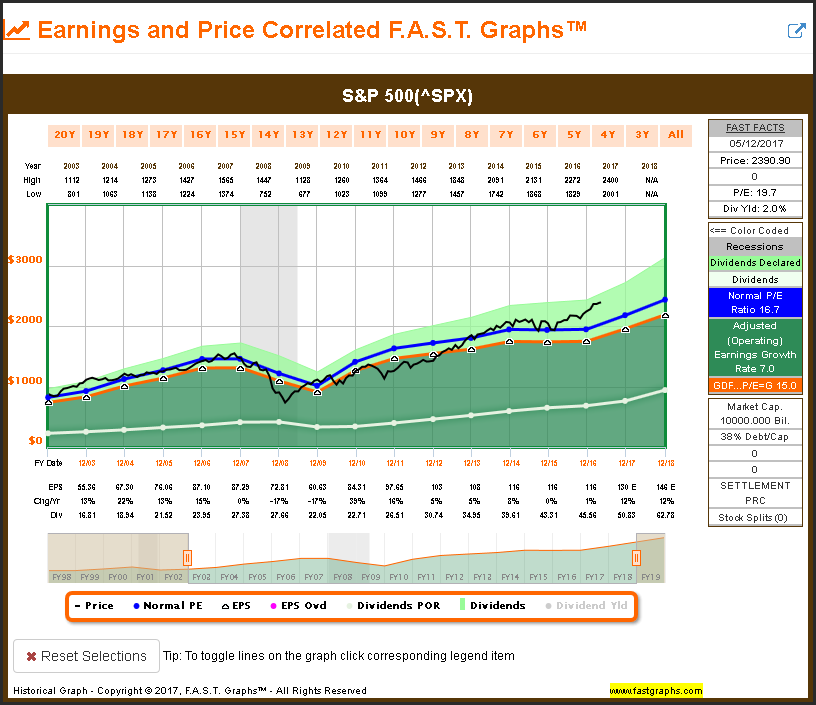
In order to establish fair and relative comparisons, I will start out by utilizing the benchmark S&P 500. Additionally, I have chosen the timeframe 2003 to current because it represents a time when the S&P 500 was reasonably valued. It also represents a timeframe several years prior to the Great Recession and the subsequent time since. Note the average earnings growth rate of 7%. Here’s what the market looked like at the beginning of 2003:
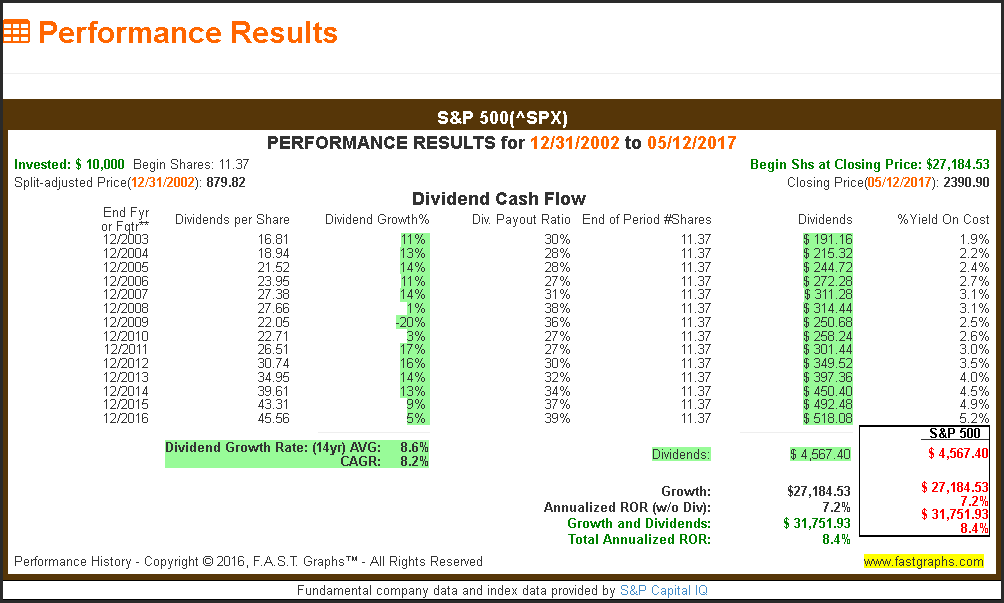
There are critical elements of the performance results associated with the S&P 500 over this timeframe that I ask the reader to focus on with this example, as well as the additional examples that I will offer later. For starters, note that the yield on cost of the S&P 500 for 2003 was 1.9%. This will serve as our benchmark yield as compared to our other examples. Also note the total cumulative dividend income that the S&P 500 produced through the end of 2016. Finally, note the total annualized rate of return of 8.4% that the S&P 500 produced.
Kimberly-Clark Corporation (KMB)
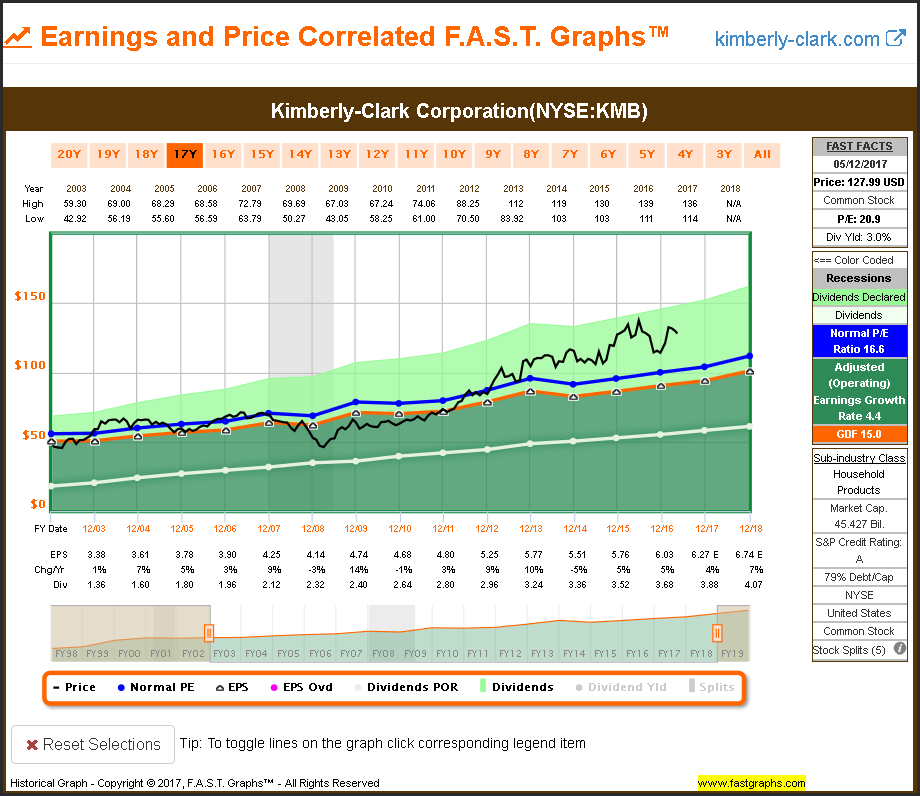
Kimberly-Clark was also soundly valued at the beginning of 2003. However, its earnings growth rate over this timeframe of 4.4% was significantly lower than the 7% earnings growth achieved by the S&P 500. Therefore, relative to earnings growth, Kimberly-Clark investors were at a disadvantage.
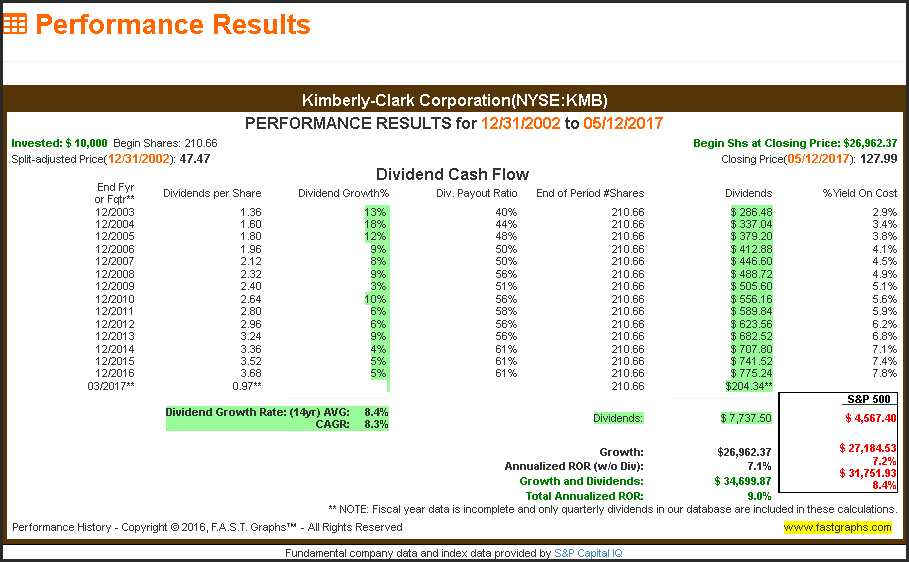
On the other hand, the initial yield on cost of 2.9% for Kimberly-Clark was higher than the 1.9% we saw with the S&P 500 above. Consequently, advantage Kimberly-Clark on a starting yield basis. This is what I meant when I suggested investing in companies that offered a current yield higher than the market.
Interestingly, capital appreciation of 7.1% for Kimberly-Clark was only modestly below the 7.2% achieved by the S&P 500. However, it is only fair to point out that I consider Kimberly-Clark relatively more overvalued currently than I do the market.
But perhaps most importantly, look at the total cumulative dividend income advantage for Kimberly-Clark over the S&P 500. When you add the total cumulative dividends with the growth, you end up with a total return of 9% versus the S&P 500’s 8.4%. So here’s a clear example where above-average yield generated better returns than the market, even with the earnings growth disadvantage.
The Southern Company (SO)
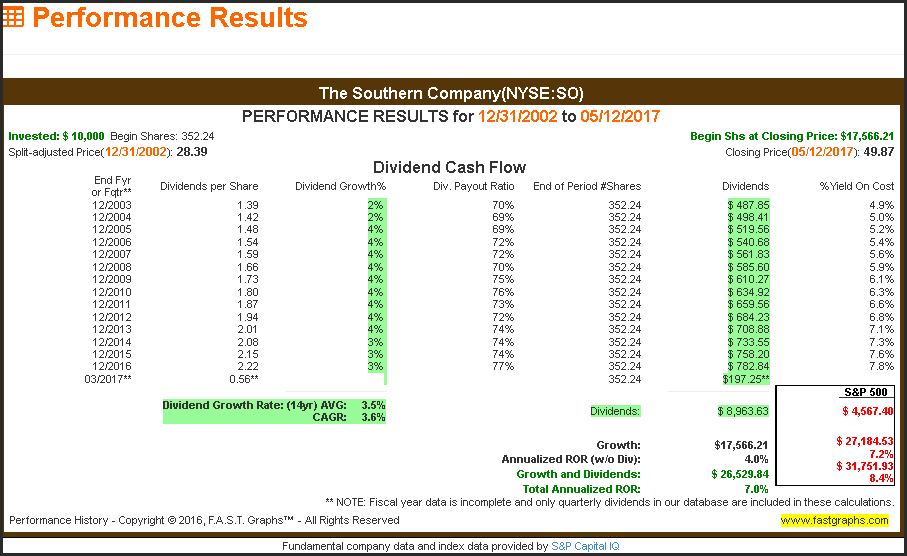
With my second example, I chose the slow growth utility stock The Southern Company. Note that earnings growth of 3.7% was approximately half the 7% growth of the S&P 500. Advantage here goes to the S&P 500 for growth.
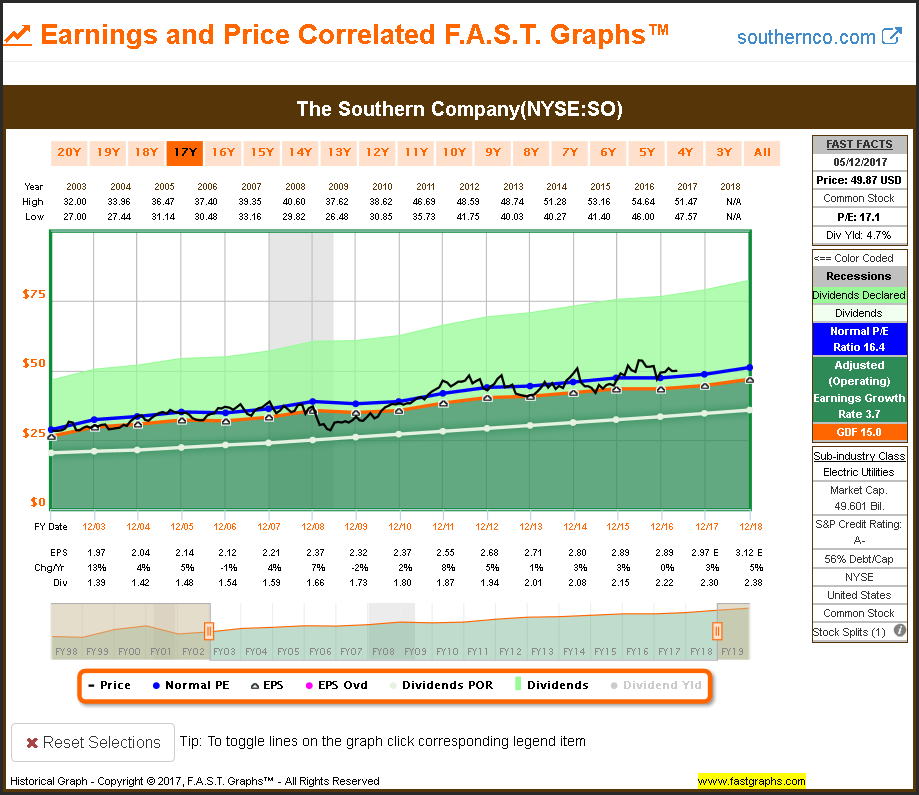
However, note the yield on cost advantage of 4.9% for The Southern Company for 2003. This is more than twice the 1.9% yield on cost we saw for the S&P 500 in 2003. Consequently, even though earnings growth was approximately half, The Southern Company generated almost twice the total cumulative dividend income than the S&P 500.
On the other hand, capital appreciation was much lower for The Southern Company at 4% versus 7.2% for the S&P 500. Nevertheless, the dividend advantage generated a total return of 7% for The Southern Company versus 8.4% for the S&P 500.
So clearly, the S&P 500 did outperform on a total return basis. However, it also significantly underperformed on a total dividend income basis. So in this case you might say we have a tie. We receive more spendable income with The Southern Company but more growth with the S&P 500. But, along with the greater dividend income, we did get some growth. This is not too bad coming from a slow growth high yielding utility stock.
Johnson & Johnson (JNJ)
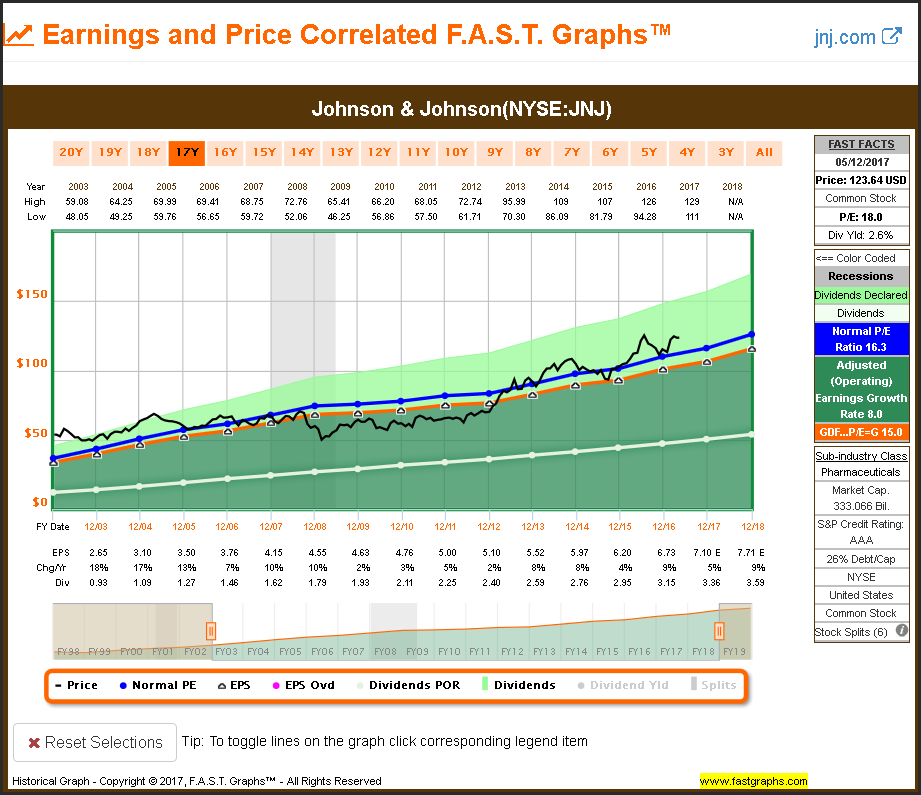
With my next example I compare the blue-chip AAA rated Johnson & Johnson to the S&P 500. The first thing I ask the reader to note is that Johnson & Johnson was significantly overvalued while the S&P 500 was fairly valued at the beginning of 2003. Therefore, on a valuation perspective the advantage goes to the S&P 500. Earnings growth was comparable with Johnson & Johnson growing at 8% versus the S&P 500 at 7%. However, here is a classic example where overvaluation diminished results.
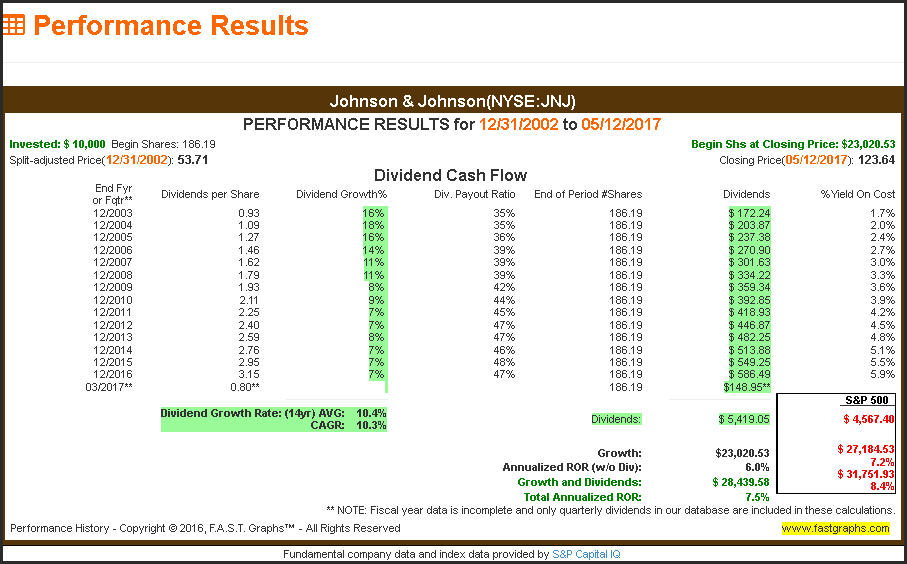
Due to the overvaluation mentioned above, Johnson & Johnson provided a yield on cost of 1.7% in 2003 versus 1.9% for the S&P 500. Consequently, Johnson & Johnson would not have met the criteria of providing above-average dividend yield at the beginning of 2003.
However, due to the slightly faster earnings growth rate, Johnson & Johnson would have produced more cumulative dividend income than the S&P 500. On the other hand, the overvaluation disadvantage caused Johnson & Johnson to underperform on a growth basis.
So to be clear, at the beginning of 2003, Johnson & Johnson would not have met the criteria of above-average yield at sound valuation. Regardless, long-term performance with this blue-chip dividend growth stock was not all that bad.
Next I would like to level the valuation playing field a little by comparing Johnson & Johnson to the S&P 500 since 2006 when both were reasonably valued. I will start with the S&P 500 below. As you can see, earnings growth for the S&P 500 was 5.1% for this timeframe.
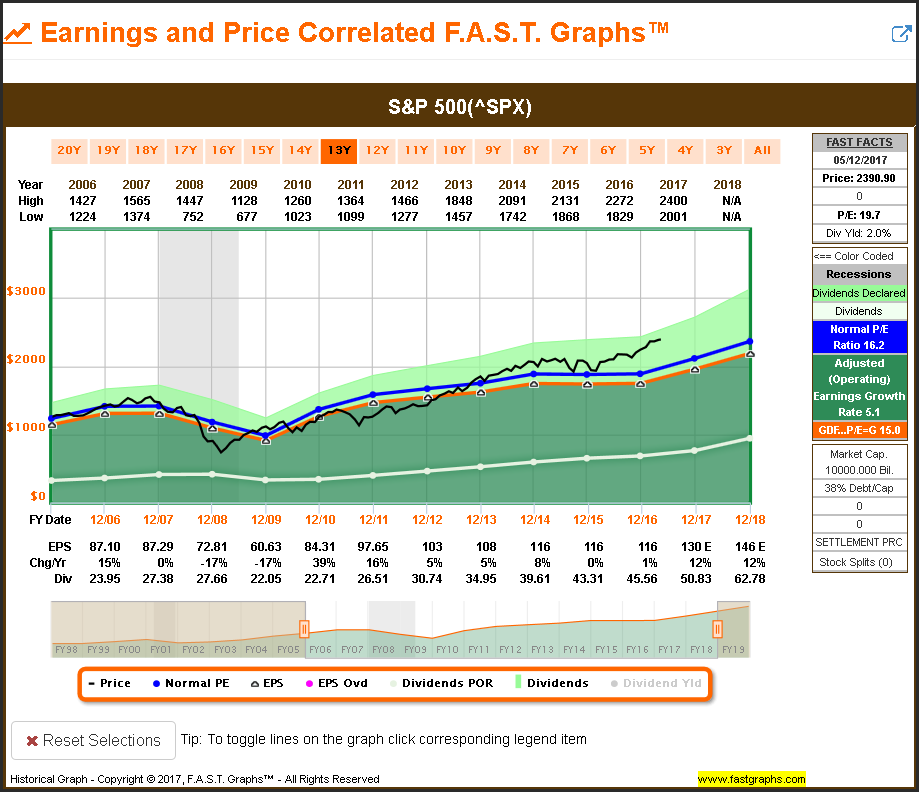
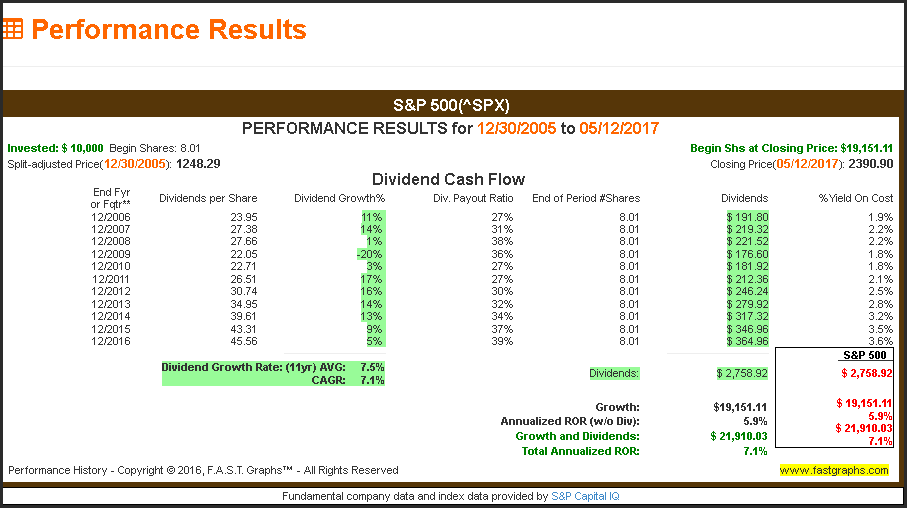
The starting yield on cost for the S&P 500 for 2006 would have been 1.9%. Capital appreciation or growth came in at 5.9% and coupled with total dividend income the S&P 500 generated a total annual return of 7.1%.
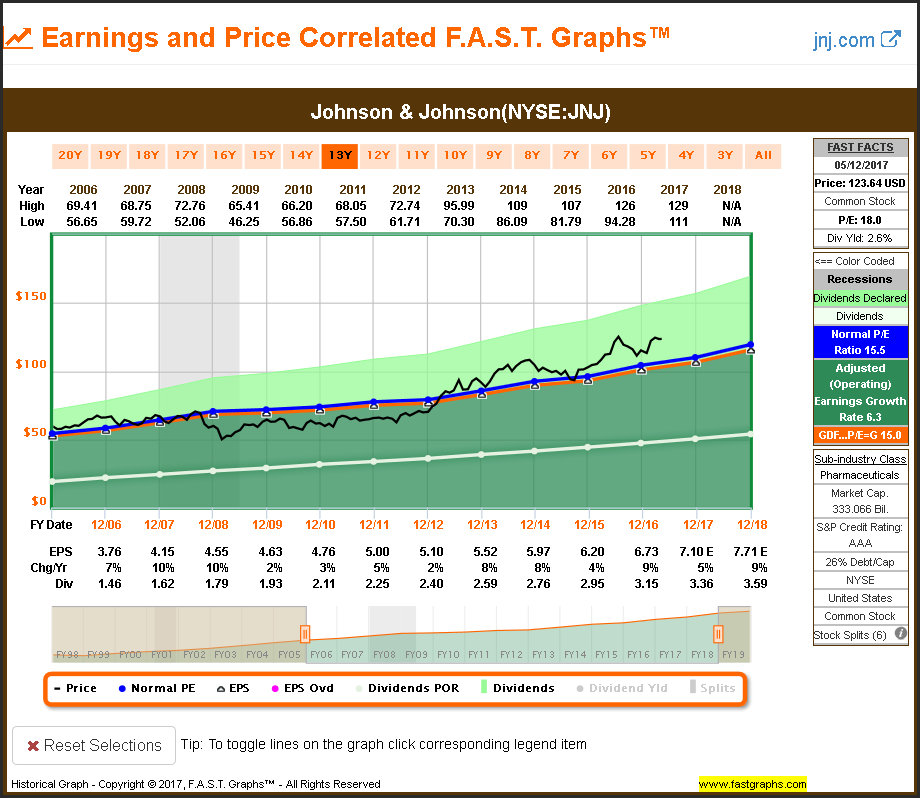
In contrast, Johnson & Johnson produced earnings growth of 6.3% since 2006 which was higher than the corresponding growth of the S&P 500. Both the S&P 500 and Johnson & Johnson are comparably currently overvalued.
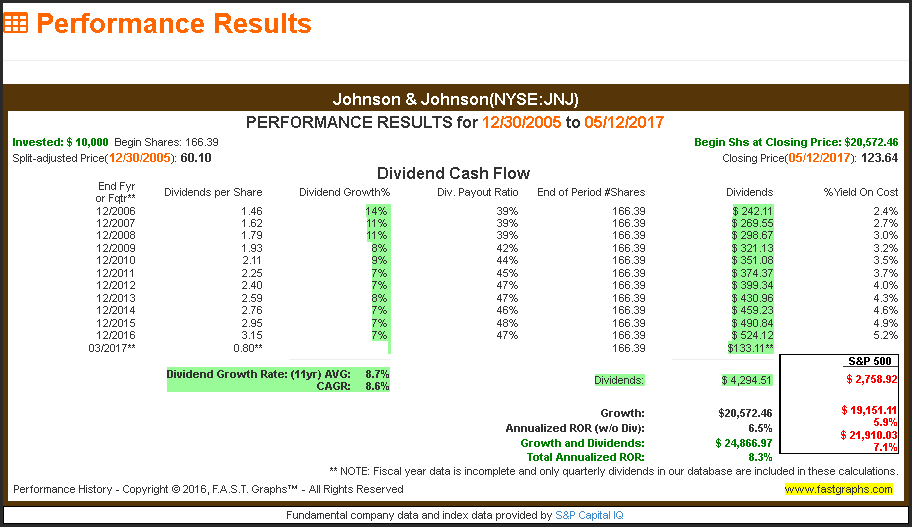
However, in contrast to what we saw with the timeframe starting in 2003, Johnson & Johnson offered a yield on cost of 2.4% in 2006 compared to the 1.9% for the S&P 500. Consequently, Johnson & Johnson at the beginning of 2006 met both criteria of sound valuation and above-average dividend yield.
Consequently, Johnson & Johnson produced significantly more cumulative dividend income than the S&P 500 over this timeframe, and it also generated a higher level of growth. Therefore, Johnson & Johnson also outperformed the S&P 500 on a total return basis. But, the key point is the reliability and predictability of the dividend income offered by this blue-chip dividend growth stalwart.
Summary and Conclusions
In closing, I find it nonsensical to debate the laurels of passive investing over active investing. First of all, as I mentioned previously, I have yet to see a clear definition of what various studies consider active management. But most importantly, the real question is whether or not a given investment strategy meets the needs, goals, objectives and risk tolerances of every investor. Frankly, I do not believe that an index such as the S&P 500 is the appropriate choice for every investor.
On the other hand, there are also different ways to measure performance. For example, the typical fixed income investor is rarely concerned with whether or not they beat the market. Instead, they tend to be primarily interested in safety and income. Therefore, I find it rather absurd to worry about whether or not you’re beating the market. Instead, I think it’s more practical and relevant to worry about whether or not your portfolios are meeting your own unique goals, objectives and risk tolerances.
Disclosure: Long KMB,JNJ,SO.
Disclaimer: The opinions in this document are for informational and educational purposes only and should not be construed as a recommendation to buy or sell the stocks mentioned or to solicit transactions or clients. Past performance of the companies discussed may not continue and the companies may not achieve the earnings growth as predicted. The information in this document is believed to be accurate, but under no circumstances should a person act upon the information contained within. We do not recommend that anyone act upon any investment information without first consulting an investment advisor as to the suitability of such investments for his specific situation.


