Mitigating risk as volatility looms
by Christopher Doll, Vice President, Product & Business Strategy, PowerShares Canada, Invesco Canada
The S&P 500 Index has gained over 11%, since the U.S. presidential election, but recently we’ve seen the first +1% daily decline in the S&P 500 Index in over three months.1
The market faced its first significant stumble as investors reacted negatively to news that Paul Ryan, Speaker of the U.S. House of Representatives, pulled the health care bill before it went to a vote, marking the first major defeat for the Trump administration.
The combination of uncertainty around President Trump’s policies, geopolitical tension surrounding both Syria and North Korea, Brexit negotiations and the recently called British election could mean the markets are in for a volatile ride.
Investing in volatile times
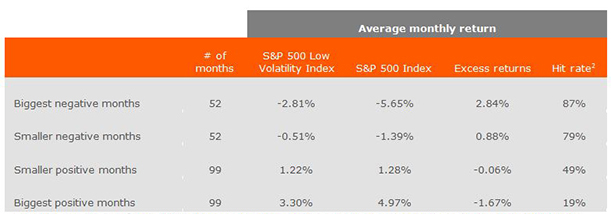
The low-volatility factor has proven to outperform in periods of market drawdowns and elevated volatility, as seen in our analysis below, which details the performance for the S&P 500 Low Volatility Index in various return scenarios. This index has consistently outperformed the broader S&P 500 Index in down months, while still participating in the gains of up months.

Source: FactSet Data from February 1, 1992 through March 31, 2017. Currency: USD. Biggest negative months consist of 50% of the highest negative monthly return of the S&P 500 Index. Smaller negative months consist of 50% of the remaining negative monthly returns of the S&P 500 Index. Biggest positive months consist of 50% of the highest positive monthly returns of the S&P 500 Index. Smaller positive months consist of 50% of the remaining positive monthly returns of the S&P 500 Index. Please refer to the end of this blog post for important information about back-tested performance data used in this analysis. Past performance is no guarantee of future results.
What about rising interest rates?
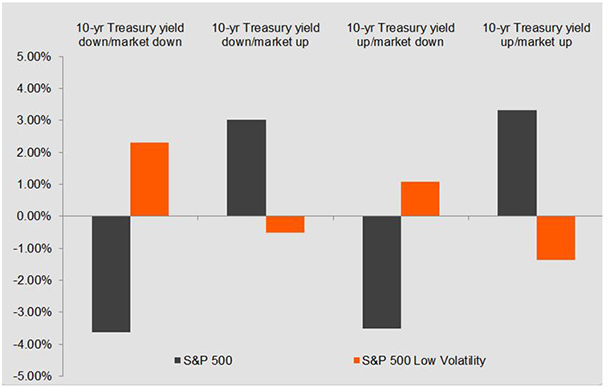
Questions about low-volatility investing typically revolve around how it will perform when interest rates rise, due to the index’s current overweight to rate-sensitive sectors such as utilities. However, our analysis has shown that performance of the S&P 500 Low Volatility Index tends to be linked more to the direction of the equity market than to the direction of bond markets. The illustration below, from S&P Dow Jones Indices, helps illustrate this trend.

Source: S&P Dow Jones Indices LLC. Data from December 31, 1990, through December 31, 2016. Currency: USD. Past performance is no guarantee of future results. Chart is provided for illustrative purposes. Please refer to the end of this blog post for important information about back-tested performance data used in this analysis.
As shown above, the S&P 500 Low Volatility Index tends to outperform in down markets while lagging in up markets. This dependency on the broader equity market is consistent, regardless of the direction of the bond market.
Mitigating risk as volatility looms
Investors have reaped the benefits of strong equity markets since mid-2016. However, as volatility starts to creep higher in both U.S. and international markets, investors may want to consider taking their gains off the table and incorporating a low-volatility strategy into their portfolio.
A low-volatility strategy can serve as a core portfolio holding, and can also be used tactically based on an investor’s volatility outlook.
Pure low-volatility exposure
The PowerShares Canada suite of low-volatility ETFs and funds offer pure exposure to the low-volatility factor without imposing any sector constraints. It’s a simple, transparent approach that allows the underlying indices to rotate out of the most volatile sectors to provide risk mitigation potential when it’s needed most.
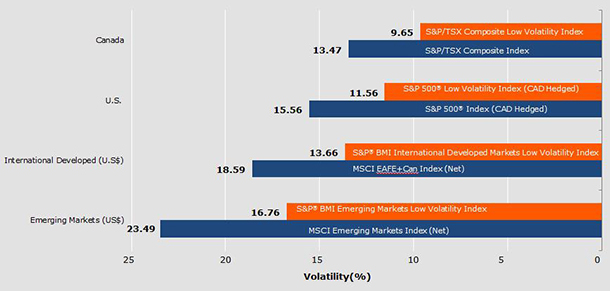
Since their inception, The PowerShares Canada suite of low-volatility ETFs and funds have exhibited lower volatility relative to their benchmark indices. For example, the S&P 500 Low Volatility Index has exhibited ~25% lower volatility relative to its benchmark index over the past 10 years. Since PowerShares S&P 500 Low Volatility Index ETF – CAD hedged index inception in January 2012, the ETF has delivered on its objective by providing ~10% lower volatility relative to its benchmark. See chart below for details.
As market volatility rises and geopolitical risks linger, a low volatility strategy can help investors experience a smoother ride during turbulent market conditions.

Sources: Morningstar Research Inc. and S&P Dow Jones Indices, data from April 1, 2007 to March 31, 2017. Currency: CAD. Please refer to the end of this blog post for important information about back-tested performance data used in this analysis. Past performance is no guarantee of future results.
† Risk is measured using standard deviation. Standard deviation measures spread or variability around the average. The larger the number, the greater the historical volatility, and the higher the potential risk.
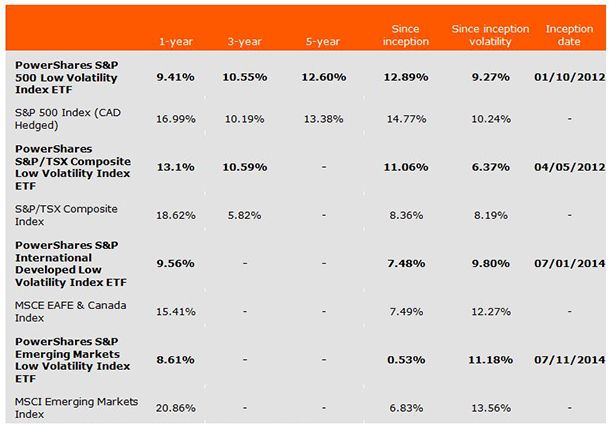
Low-volatility performance, from PowerShares Canada

Source: Morningstar Research Inc., as at March 31, 2017
If you have any questions, please leave them in the comment area below.
This post was originally published at Invesco Canada Blog
Copyright © Invesco Canada Blog


