


by Lance Roberts, Clarity Financial
In this past weekend’s missive, “Markets Go On Alert,” I stated that due to the oversold condition of the market on a very short-term basis, a rally was due this week. To wit:
“IMPORTANT: By the time weekly signals are issued on an intermediate-term basis, the market is generally oversold, with ‘bearish’ sentiment increasing, on a short-term (daily) basis. Given those short-term conditions, it is quite likely the markets will rally next week.”
Chart updated through Monday’s close.

“IMPORTANT: It is the success or failure of that rally attempt that will dictate what happens next.
-
If the market can reverse course next week, and move back above the 50-dma AND break the declining price trend from the March highs, then an attempt at all time highs is quite likely. (Probability Guess = 30%)
-
However, a rally back to the 50-dma that fails will likely result in a continuation of the correction to the 200-dma as seen previously. From current levels that would suggest a roughly -5% drawdown. However, as shown below, those drawdowns under similar conditions could approach -15%. (Probability Guess = 70%)”
I have denoted both setups in the chart above. The downtrend resistance from the March highs is quite evident as well as the 50-dma resistance at 2353 currently. Furthermore, as noted, the oversold condition has provided the “fuel” for a reflexive, “oversold,” bounce.
The chart below is the ratio between the 3-Month Volatility Index and the Volatility Index (VIX). As shown, when this ratio declines to 1.00, or less, it has generally coincided with short-term bottoms in the market.
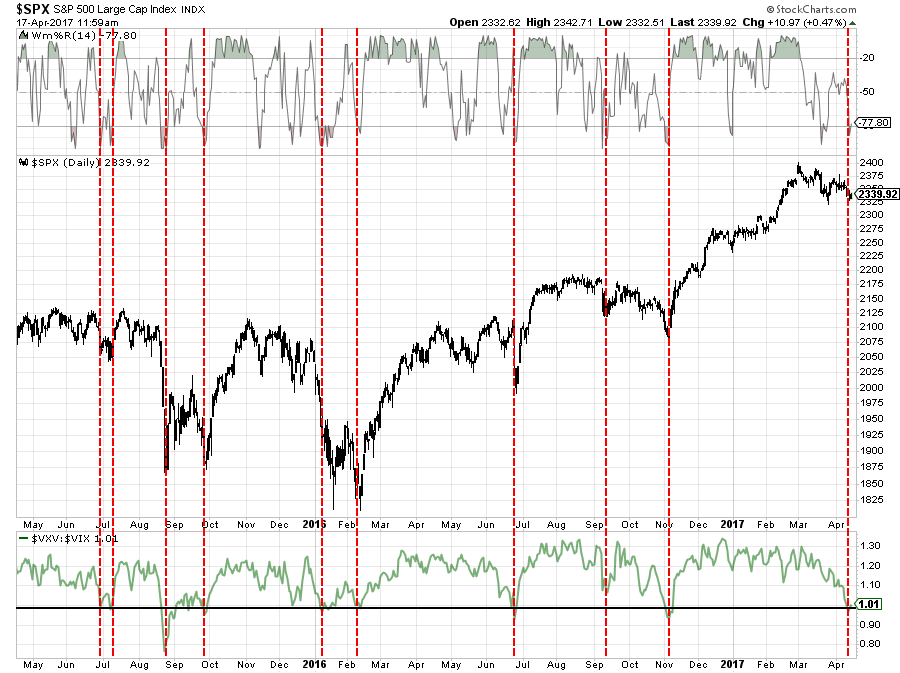
It is worth noting that in several cases, these “oversold” conditions were generally precursors to a future decline.
But how can we tell the difference?
This is where we have to step away from a very short-term view and move to an intermediate-term perspective. The chart below is essentially the same as above but the data is weekly, versus daily, which reduces some of the “noise.”
As shown, when the volatility ratio has hit low levels previously, the determination of whether the subsequent rally failed or succeeded was dependent upon how “overbought or oversold” the market was at the time of the volatility ratio low. If the volatility low was hit with the market still primarily overbought, a subsequent decline in the markets tended to follow. The best buying opportunity came when the volatility low coincided with an oversold condition in the market on a weekly basis. Such is not the case today.

Does this mean the market is about to crash? No.
However, it does suggest that as we wrap up the “seasonally strong” period of the year, the markets may run into some trouble this summer given the recent rise in uncertainty in both the geopolitical and fiscal policy backdrop.
As I noted in my recent presentation at the 2017 Economic and Investment Summit, the main support for stocks has been the hopes of tax reform, tax cuts, and infrastructure spending. Given the current problems in Washington D.C. in getting legislative agenda agreed to by Congressional Republicans, delays should be expected.
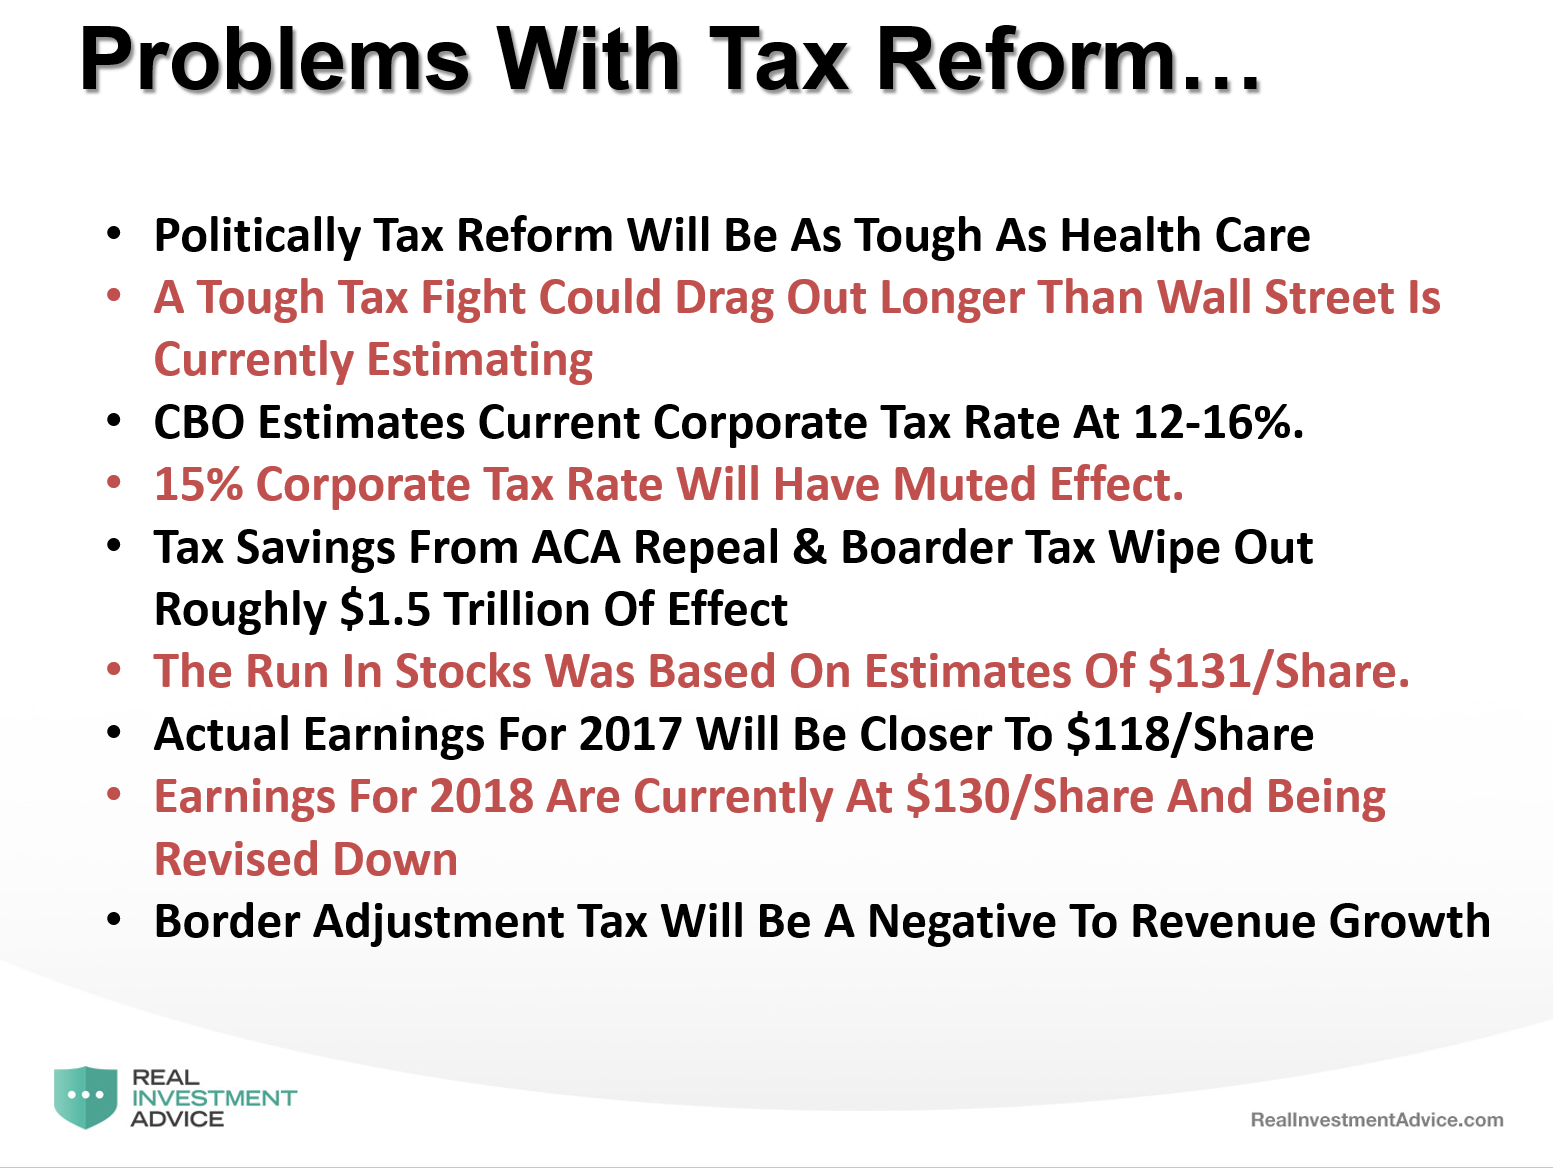
The question, of course, is just how much time the markets will give Washington to make progress on legislative agenda? As noted above, the estimates currently driving stocks were based on tax cuts being brought through to boost bottom line profitability. If those cuts don’t happen soon, earnings disappointments may bite investors.
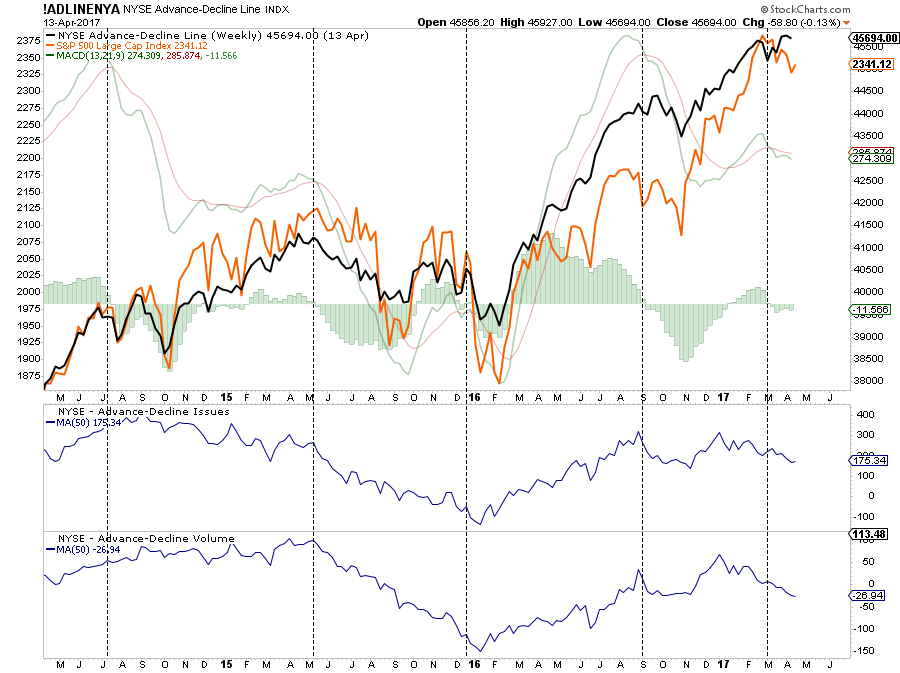
A look at the weekly internals of the market shows some notable deterioration in both the advancing-declining issues and volume. With a weekly “sell” signal in place for the NYSE Advance-Decline line, it suggests more weakness ahead.
Importantly, given these are weekly signals, it does NOT MEAN stocks can’t rally in the short-term. It simply suggests there is selling pressure on stocks the path of least resistance currently is lower.
If we apply a Fibonacci retracement to a weekly chart, shown below, a correction to the first retracement level would take the market back to 2208. While the Williams %R at the top, and the Full Stochastics at the bottom, are effectively the same measure, they tell us two things.
- The market, on a weekly basis, is very overbought.
- The weekly “sell” signal combined with the overbought condition suggests a move to the first retracement level is possible over the course of the next few weeks.

Again, while a short-term bounce in likely given the recent sell-off, it will require a move to new highs to reverse the currently more “bearish” dynamics at work in the market.
Bulls Still In Charge
The good news for the bulls is that on a long-term, monthly basis, the ongoing bull market remains intact for now. As noted below by the vertical blue dashed line, the monthly “buy signal” that was registered at the end of 2010, as the market moved above the long-term supportive trend line going back to 1965, remains for now. However, given the current extension of the market, and the deviation between the current price and long-term average, a reversion to the mean could be quite painful while the market remains within the “confines” of a bullish trend.
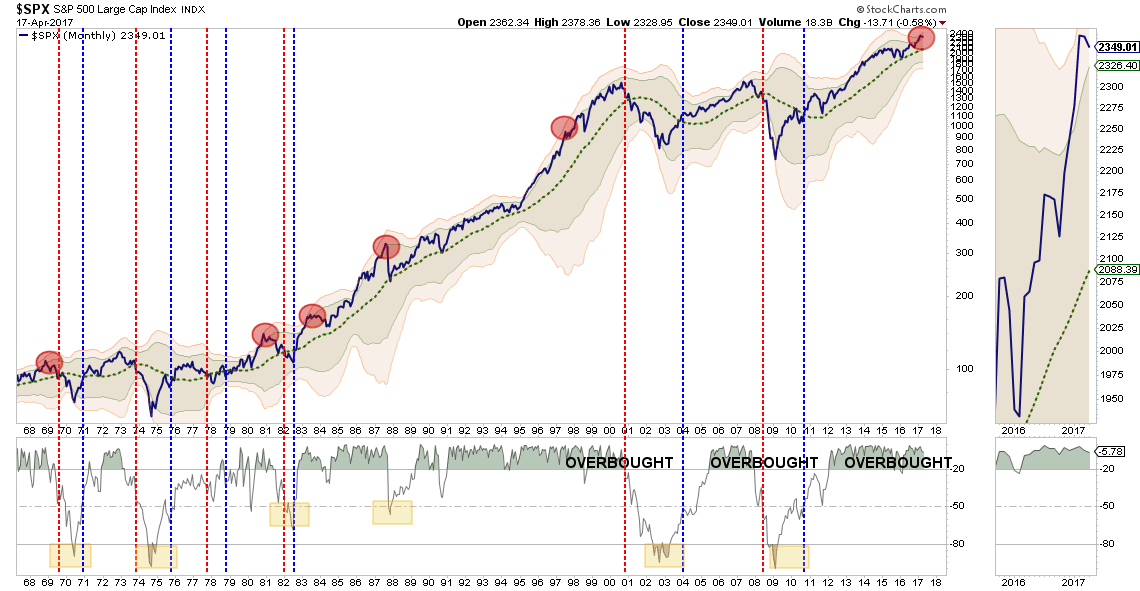
More importantly, as denoted by the red circles, the market is currently trading 3-standard deviations above the long-term average. This has only happened a few times in history and has generally preceded a rather sharp correction in the not too distant future.
Conclusion & Suggestions
With the seasonally strong period of the market coming to its inevitable conclusion, geopolitical tensions rising, economic data trending weak and fiscal policy in a bit of a disarray – it may be time for investors to rethink levels of risk exposure in their portfolios currently.
As I stated at the beginning of March, we reduced exposure in portfolios by raising cash and rebalancing portfolios back to target weightings. We had also added interest rate sensitive hedges to portfolios back in January as well. (I update our portfolio strategy in the weekly newsletter.)
Given the weekly “sell” signals currently in place, the recommendation to rebalance portfolio risks remains. Here are the guidelines I recommended previously:
Step 1) Clean Up Your Portfolio
- Tighten up stop-loss levels to current support levels for each position.
- Take profits in positions that have been big winners
- Sell laggards and losers
- Raise cash and rebalance portfolios to target weightings.
Step 2) Compare Your Portfolio Allocation To Your Model Allocation.
- Determine areas requiring new or increased exposure.
- Determine how many shares need to be purchased to fill allocation requirements.
- Determine cash requirements to make purchases.
- Re-examine portfolio to rebalance and raise sufficient cash for requirements.
- Determine entry price levels for each new position.
- Determine “stop loss” levels for each position.
- Determine “sell/profit taking” levels for each position.
(Note: the primary rule of investing that should NEVER be broken is: “Never invest money without knowing where you are going to sell if you are wrong, and if you are right.”)
Step 3) Have positions ready to execute accordingly given the proper market set up. In this case, we are looking for a rally to reduce the oversold condition of the market and allow for a better opportunity to rebalance equity risk.
As noted in yesterday’s missive on 10-Investment Wisdoms:
“The absolute best buying opportunities come when asset holders are forced to sell.” – Howard Marks
But you can’t buy low, if you didn’t sell high to raise the cash, first.
Stay alert…things are finally getting a lot more interesting.
Lance Roberts

Lance Roberts is a Chief Portfolio Strategist/Economist for Clarity Financial. He is also the host of “The Lance Roberts Show” and Chief Editor of the “Real Investment Advice” website and author of “Real Investment Daily” blog and “Real Investment Report“. Follow Lance on Facebook, Twitter and Linked-In