MARKET ETHOS: Let’s Make a Deal
by Craig Basinger, CFA, Connected Wealth, RichardsonGMP
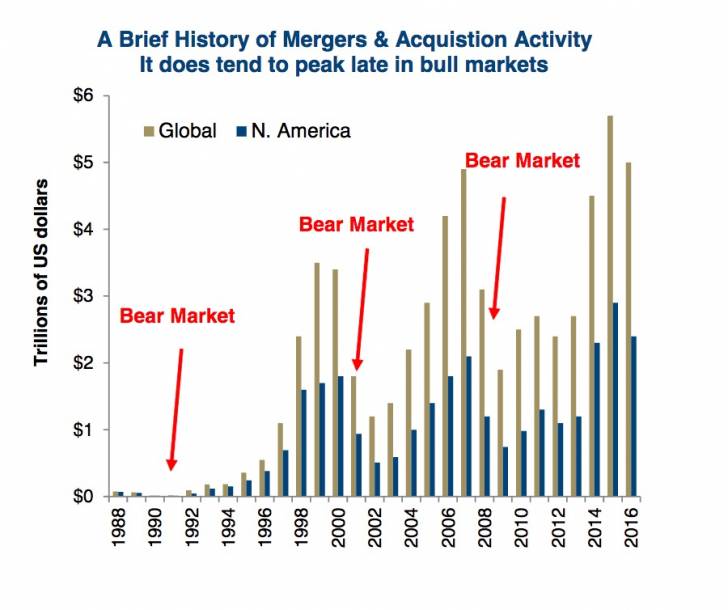
In 2015, a new all-time record was set for the dollar value of worldwide mergers and acquisitions (M&A), at an impressive $5.7 trillion. This bested the previous record of $4.9T in 2007 and made the M&A binging late in the tech bubble look small by comparison (chart). Over time the market gets bigger, as do the size of deals. Another interesting observation is deal activity tends to peak late in bull markets. This isn’t too surprising, given late in a bull market you typically see more greed than fear. The economic data tends to be doing well, driving aggregate end demand. Higher end demand triggers CEOs to want to expand to meet the demand and often the quickest path to do so is to buy another company.
This raises a couple questions: is the drop in M&A activity in 2016 a sign that this bull market cycle is about to end? How is 2017 stacking up?
2016 Drop in M&A
M&A activity did decline in 2016, dropping -12% from the record set in 2015. This drop was across most sectors, with notable declines in Energy and Technology. However the decline could easily be attributed to market weakness in early 2016. And really, a 12% decrease is not that material. Even with such a decline, it just brought M&A activity back to peak levels set late in the 2003-07 bull run.
A contributing factor was certainly the drop in investment in the Energy sector as oil fell from the $100 level in 2015 to below $50. In this kind of environment, it is not surprising CEOs became more cautious. But much has changed in 2017.
2017 Stacking up to be a record…so far
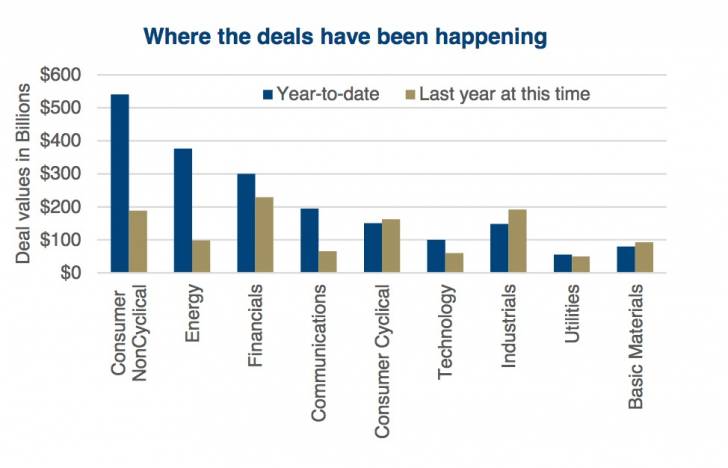
It is clearly too early to celebrate as there are still 8 and a half months left to go, but 2017 is off to a very impressive start. So far we have seen $1.9 trillion in announced, completed or pending deals. If this pace continued for the rest of the year, we would finish at a new record of $6.7 trillion. Comparing the current deals to the same point last year has activity up an incredible 72%. This may be somewhat skewed to the upside given Q1 of 2016 was so weak. Still, an impressive pace.
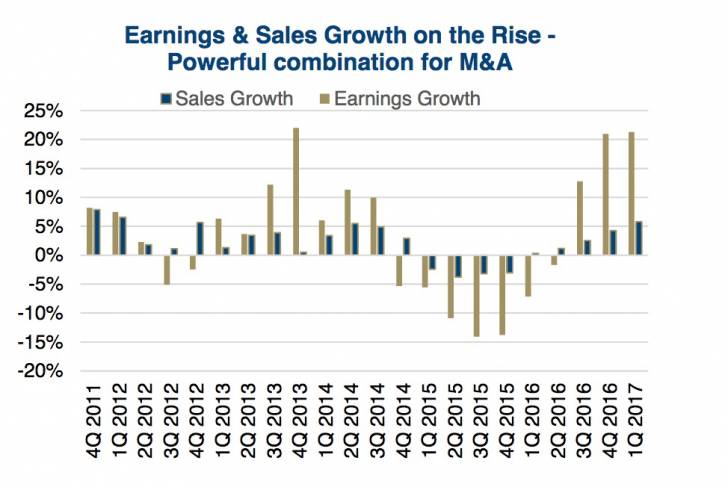
There are a number of strong contributing factors to M&A activity this year. Earnings growth has returned, with S&P 500 earnings expected to expand by over 20% in Q1. Plus sales growth is also returning. This is a good proxy for aggregate demand and when end demand is rising it certainly encourages CEOs to pull the trigger on making acquisitions to expand their business to try and capture more of this end demand (1st chart).
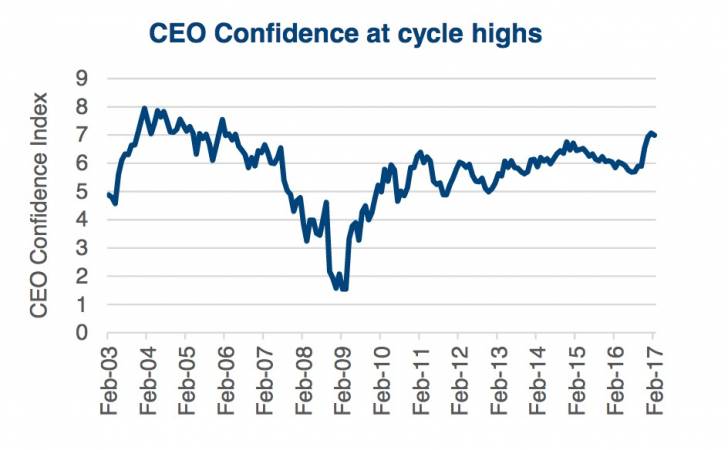
As evidence that higher earnings and higher sales growth begets greater CEO confidence, the CEO Confidence Index is at cycle highs (2nd chart). This is a diffusion index which asks a large number of CEOs how they see the economy one year into the future. A higher or rising number means CEOs are becoming more confident. It has not reached 2004-07 levels, but the trend over the past half year has been on the rise. We would also highlight that the drop in M&A activity did coincide with CEO confidence gradually declining for much of 2016.
Add to this the ease of financing deals remains attractive. The debt market continues to price bonds, both high yield and investment grade, at historically low spreads over Treasuries. U.S. investment grade spreads are 68bps which is near trough levels. Even high yield at 345bps is near trough levels of 300bps. Both are well below the average spread over the past five years of 82bps for investment grade and 391bps for high yield.
The equity market is also accommodative for raising capital. IPOs and secondary issuance is up 13% from last year. This is higher across all sectors.
The real big driver of increased M&A activity has been the Consumer Noncyclical and Energy (3rd chart).
Investment Implications
So we have more confident CEOs, strong earnings growth, decent sales growth and accommodative capital markets. That is a powerful combination to encourage rising Mergers and Acquisitions. “Guessing” at take-over candidates does not have a clear path to success, focusing on those who benefit from higher M&A activity may be more prudent. Financials, especially those with large investment banking and advisory divisions, are certainly poised to benefit from higher activity.
This is also a general positive for the overall market. Especially if CEOs become too confident and overpay for assets. That being said, record M&A activity is also a core characteristic of the late stages of a bull market. The end may not be nigh, but it is getting closer.
*****
Charts are sourced to Bloomberg unless otherwise noted.
This material is provided for general information and is not to be construed as an offer or solicitation for the sale or purchase of securities mentioned herein. Past performance may not be repeated. Every effort has been made to compile this material from reliable sources however no warranty can be made as to its accuracy or completeness. Before acting on any of the above, please seek individual financial advice based on your personal circumstances. However, neither the author nor Richardson GMP Limited makes any representation or warranty, expressed or implied, in respect thereof, or takes any responsibility for any errors or omissions which may be contained herein or accepts any liability whatsoever for any loss arising from any use or reliance on this report or its contents. Richardson GMP Limited is a member of Canadian Investor Protection Fund. Richardson is a trade-mark of James Richardson & Sons, Limited. GMP is a registered trade-mark of GMP Securities L.P. Both used under license by Richardson GMP Limited.
Copyright © Connected Wealth, RichardsonGMP