


Diversification: An Expensive Lunch Recently, But Free Over Time
The Benefits of Diversification Ebb and Flow, But Now is Not the Time to Abandon the Time-Tested Strategy
By Brandon Thomas, Chief Investment Officer, Envestnet PMC
March 2017 | View PDF here
One of the most important concepts taught to MBA students in Investments 101 is that portfolio diversification is fundamental to a sound investment strategy. In 1952, Harry Markowitz, pioneer of Modern Portfolio Theory, coined the oft-cited phrase, “Diversification is the only free lunch” in finance. Diversification has earned this reputation because of its ability to produce superior risk-adjusted returns over time.
PMC firmly believes in the value of diversification, and we reflect that philosophy in the construction of our portfolios. In our Quantitative Research Group’s (QRG) study, Capital Sigma: The Sources of Advisor-Created Value (2015), we find that appropriate diversification can indeed deliver positive active, or excess, return over time.
While diversification works over time, it does not work all the time. In some periods, which have lasted for several years, asset class diversification has not worked. Undoubtedly, there will be periods in the future where diversification will underperform.
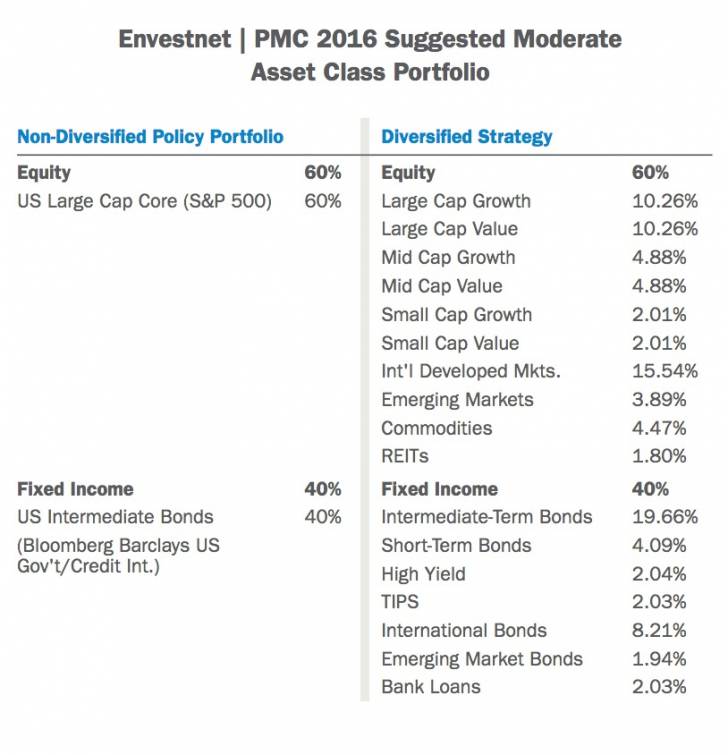
To illustrate the cyclicality of diversification’s benefits, we look at the 18-year period from 1/1/1999 through 12/31/2016. We study the performance of a moderate allocation strategy, comparing a 60/40 diversified strategy to a non-diversified policy portfolio. The non-diversified policy portfolio consisted of 60% US equities (S&P 500) and 40% US intermediate fixed income (Bloomberg Barclays US Government/Credit Intermediate Index). The diversified strategy was allocated in accordance with PMC’s 2016 Suggested Moderate Asset Class Portfolio (ACP).
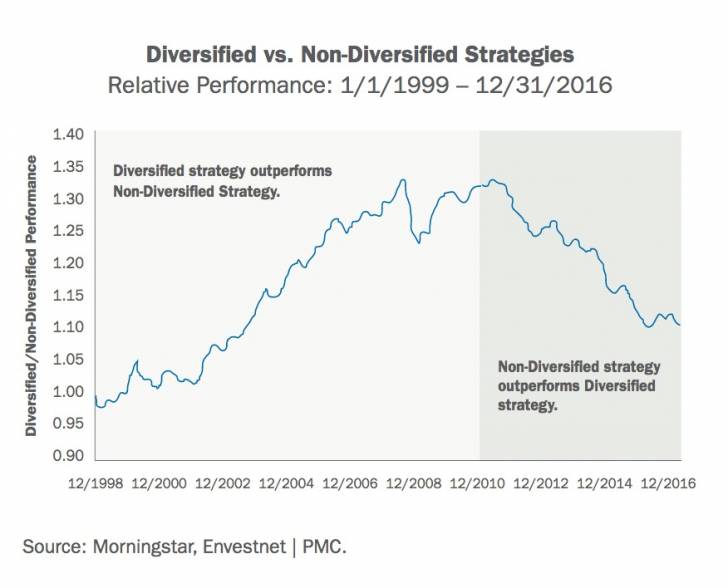
The graph to the right shows the relative performance of the diversified strategy compared to the non-diversified strategy. For approximately 12 years beginning in 1999, the diversified portfolio performed very well relative to the non-diversified policy portfolio, as indicated by the rising line.
The one exception during this period was the peak of the financial crisis in the latter half of 2008, during which the safe-haven, US-focused nature of the non-diversified policy portfolio did a better job of protecting capital.
However, the picture changes dramatically over the next six years, beginning in 2011. The diversified portfolio significantly underperforms the non-diversified portfolio. Exploring the explanations as to why this cyclicality has occurred is beyond the scope of this piece, but possible reasons include monetary policy differences between the US and international economies, as well as varying investor risk appetites. The graph below contains a comparative analysis of these individual sub-periods, and shows that over the 12 years ending 12/31/2010 the diversified strategy generated an annualized active return of +244 basis points relative to the non-diversified strategy.
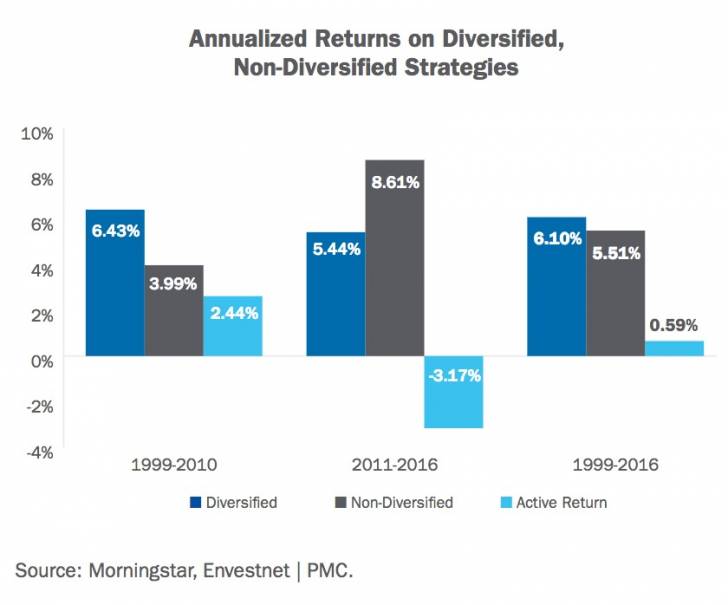
As noted above, however, the ensuing six-year period ending 12/31/2016 was a difficult one for the diversified strategy, as it delivered an annualized active return of -317 basis points. The diversified portfolio’s struggles were most acute in the three years from 2013-2015, during which the strategy produced an annualized active return of -469 basis points. Note also that including alternative investment asset classes and employing active managers would have exacerbated the diversified strategy’s underperformance during this period. Despite the poor recent results, diversification has added value over the entire 18-year period, with the diversified strategy outperforming the non-diversified policy portfolio by an annualized +59 basis points.
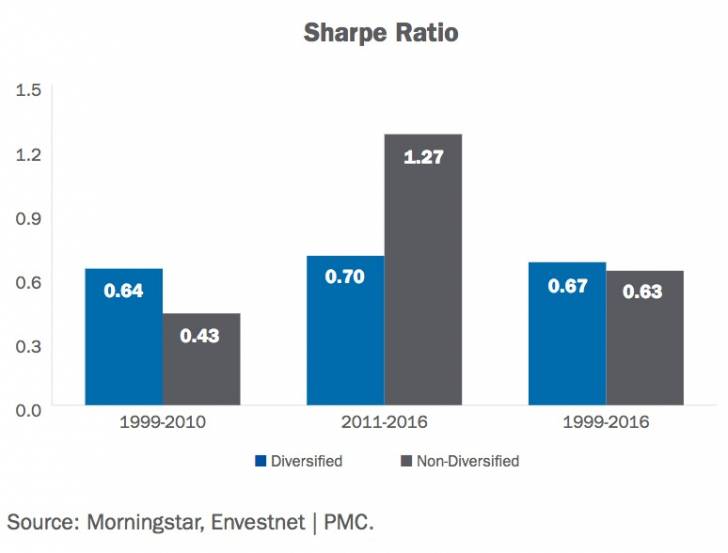
Diversification has also proven its worth over time on a risk-adjusted basis, as demonstrated in the Sharpe Ratio graph below. The non-diversified strategy benefited from an extremely low volatility environment for domestic US equities and fixed income over the past few years. But the longer-term, volatility-dampening characteristics of a diversified strategy that originally prompted Markowitz’s famous phrase continue to hold true.
Primary Asset Class Contributors to Active Return
Analysis of the contributions from individual asset classes during these periods is also instructive. The table below lists the asset classes comprising the diversified portfolio, as well as their respective annualized contributions to active returns.
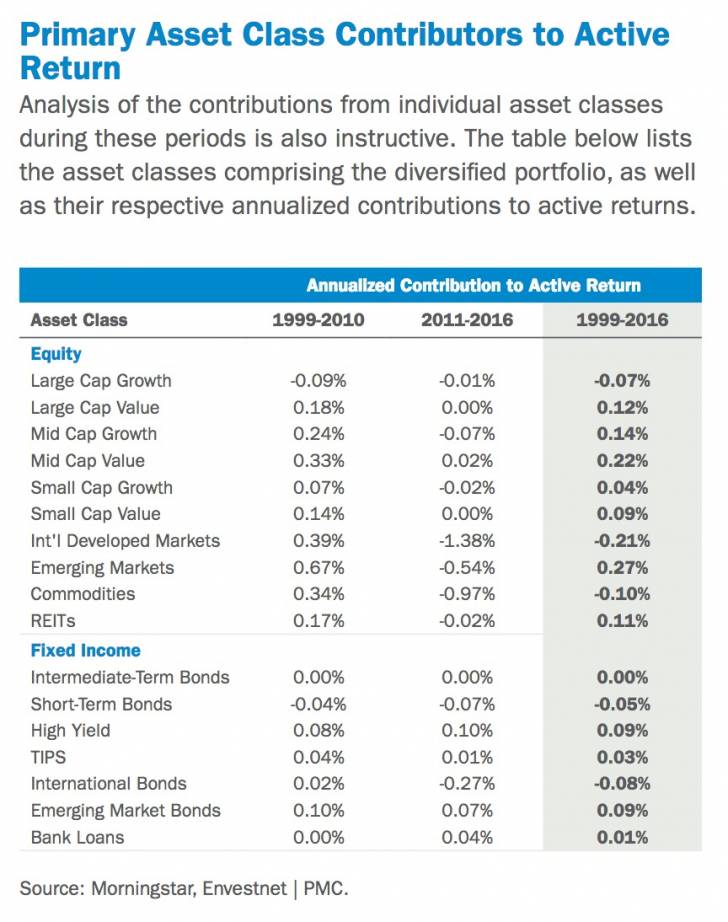
For the 1999-2010 period, each asset class contributed positive or neutral active returns, with the exceptions of Large Cap Growth and Short-Term Bonds. In the equity segment, Emerging Markets (+67 bps), Int’l Developed Markets (+39 bps), Commodities (+34 bps), and Mid Cap Value (+33 bps) were primary contributors. Emerging Markets Bonds (+10 bps) and High Yield (+8 bps) contributed most in the fixed income segment.
For the disappointing 2011-2016 period, most of the equity asset classes contributed negatively to performance, with Mid Cap Value (+2 bps) being the only asset class generating positive annualized contribution. Far and away the biggest detractors from annualized performance during the period in the equity segment were Int’l Developed Markets (-138 bps), Commodities (-97 bps), and Emerging Markets (-54 bps). For the three years spanning 2013-2015, those three asset classes accounted for an aggregate -382 basis points of active return. Within the fixed income segment during 2011.2016, High Yield added value (+10 bps), but the International Bonds asset class was a significant detractor (-27 bps).
Without question, diversified portfolios in recent years have materially underperformed non-diversified strategies invested in US large cap equities and intermediate-term bonds. But the recent results should not deter investors from employing a strategy of diversification at the asset class level. Just as it is extremely difficult to successfully time the market on a consistent basis, it is equally as difficult to predict when and why a diversified strategy may underperform. Advisors and their investor clients would be well served to maintain an appropriately diversified portfolio to have a great opportunity to generate superior risk-adjusted returns.
*****
About Envestnet | PMC™
Envestnet, Inc. (NYSE: ENV) is the leading provider of intelligent systems for wealth management and financial wellness. Envestnet’s unified technology enhances advisor productivity and strengthens the wealth management process. Envestnet empowers enterprises and advisors to more fully understand their clients and deliver better outcomes.
Envestnet | PMC provides independent advisors, broker-dealers, and institutional investors with the research, expertise, and investment solutions—from due diligence and comprehensive manager research to portfolio consulting and portfolio management—they need to help improve client outcomes. For more information on PMC, please visit investpmc.com
© 2017 Envestnet. All rights reserved. FOR ONE-ON-ONE USE WITH A CLIENT’S FINANCIAL ADVISOR ONLY. | 3 Diversification: An Expensive Lunch Recently, But Free Over Time
INDEX OVERVIEW
Index performance is presented for illustrative purposes only and does not represent the performance of any specific investment product or portfolio. An investment cannot be made directly into an index. The S&P 500 Index is an unmanaged index comprised of 500 widely held securities considered to be representative of the stock market in general. The Barclays Capital U.S. Intermediate Government/Credit Bond Index measures the performance of U.S. Dollar denominated U.S. Treasuries, government-related and investment grade U.S. corporate securities that have a remaining maturity of greater than one year and less than ten years. DISCLOSURES
The information, analysis, and opinions expressed herein are for general and educational purposes only. Nothing contained in this review is intended to constitute legal, tax, accounting, securities, or investment advice, nor an opinion regarding the appropriateness of any investment, nor a solicitation of any type. All investments carry a certain risk, and there is no assurance that an investment will provide positive performance over any period of time. An investor may experience loss of principal. Investment decisions should always be made based on the investor’s specific financial needs and objectives, goals, time horizon, and risk tolerance. The asset classes and/or investment strategies described may not be suitable for all investors and investors should consult with an investment advisor to determine the appropriate investment strategy. Past performance is not indicative of future results. Information obtained from third party sources are believed to be reliable but not guaranteed. Envestnet|PMC™ makes no representation regarding the accuracy or completeness of information provided herein. All opinions and views constitute our judgments as of the date of writing and are subject to change at any time without notice. Investments in smaller companies carry greater risk than is customarily associated with larger companies for various reasons such as volatility of earnings and prospects, higher failure rates, and limited markets, product lines or financial resources. Investing overseas involves special risks, including the volatility of currency exchange rates and, in some cases, limited geographic focus, political and economic instability, and relatively illiquid markets. Income (bond) securities are subject to interest rate risk, which is the risk that debt securities in a portfolio will decline in value because of increases in market interest rates. Exchange Traded Funds (ETFs) are subject to risks similar to those of stocks, such as market risk. Investing in ETFs may bear indirect fees and expenses charged by ETFs in addition to its direct fees and expenses, as well as indirectly bearing the principal risks of those ETFs. ETFs may trade at a discount to their net asset value and are subject to the market fluctuations of their underlying investments. Investing in commodities can be volatile and can suffer from periods of prolonged decline in value and may not be suitable for all investors. Index Performance is presented for illustrative purposes only and does not represent the performance of any specific investment product or portfolio. An investment cannot be made directly into an index. Neither Envestnet, Envestnet|PMC™ nor its representatives render tax, accounting or legal advice. Any tax statements contained herein are not intended or written to be used, and cannot be used, for the purpose of avoiding U.S. federal, state, or local tax penalties. Taxpayers should always seek advice based on their own particular circumstances from an independent tax advisor. PAST PERFORMANCE IS NOT INDICATIVE OF FUTURE RESULTS.
PMC_WP_DIV17_0317 SR #882097 © 2017 Envestnet. All rights reserved. FOR ONE-ON-ONE USE WITH A CLIENT’S FINANCIAL ADVISOR ONLY.
Copyright © Envestnet PMC