by Jodie Gunzberg, Managing Director, Product Management, S&P Dow Jones Indices
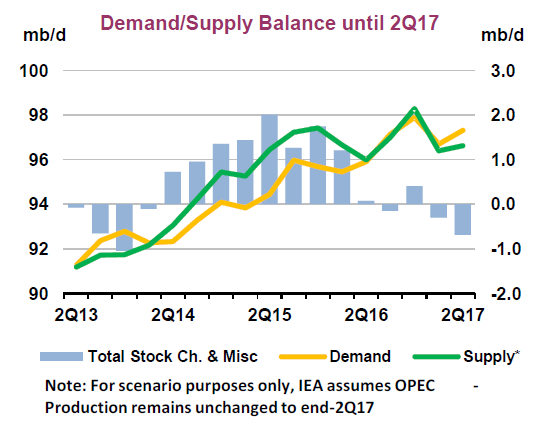
Although many analysts anticipated U.S. oil producers would fill the gap from production cuts by OPEC and some non-OPEC producers, not many probably guessed Brent would have its second worst Q1 in history, losing 7.6%, after the implementation of the production cuts. According to the Information Energy Agency (IEA,) the U.S. saw a triple surge in supply from rising imports and domestic production as well as lower refinery utilization. Also while the countries in OPEC have complied pretty well with the cuts pledged, non-OPEC countries have been slower to adhere. The result is it may take significant time for the market to re-balance despite some demand growth.

Source: International Energy Agency, Oil Market Report. March 2017.
With the demand optimism, the S&P GSCI Industrial Metals started the year out strongly, up 9.2% that is its best first quarter since 2008; however, the sector started to slip slightly in March, ending down 94 basis points for the month. Given oil prices have become a major macroeconomic factor, there is concern the energy sector chaos could spill into the other commodities.
In March, the S&P GSCI Total Return lost 3.9% bringing its year-to-date loss to -5.1%, and the Dow Jones Commodity Index (DJCI) Total Return fell 2.8% for a year-to-date loss of 2.0%. The S&P GSCI Energy Total Return was the worst performing sector for the month, losing 4.9%, and S&P GSCI Livestock Total Return was the only positive sector in March, gaining 1.2%, to bring its year-to-date performance up to 1.2%. Not only were 4 of 5 sectors down but only 7 single commodities were positive, which is the fewest number of positive commodities since Nov. 2015. Natural gas was the best performer in the month, up 12.2% from supply disruptions, and also other gainers were aluminum +1.7%, lead +3.6%, cotton +1.4%%, cocoa +9.8%, feeder cattle +7.1% and live cattle +2.7%. Sugar was the worst performing commodity, losing 12.8% in the index from a favorable production outlook in Brazil and the prospect of a rebound in Indian output next season.
However, sugar inventories are still relatively low and it is not the only commodity with low enough inventories to be in backwardation. In March, 8 commodities were in backwardation, which is double the 4 singles that were backwardated in Feb, and is also the highest number of backwardated commodities since July 2016. In addition to sugar, the other commodities in backwardation are coffee, feeder cattle, Kansas wheat, live cattle, silver, soybeans and wheat.
Another bullish sign potentially is the outperformance of industrial metals over energy. In the first quarter, the spread is 18.8%, the biggest since the premium of 20.7% in March 2009, that was at the bottom for commodities in the global financial crisis . Given the favorable upside potential to downside risk in energy at this point, there is a chance industrial metals can continue performing if the economic demand can keep pace. Even though brent had its second worst start to the year along with gasoil, and unleaded gasoline had it worst ever q1 in history, aluminum posted its second best ever q1 with other strong starts from lead (4th best q1) and gold (5th best q1.)

Source: S&P Dow Jones Indices
This article is a publication of S&P Dow Jones Indices LLC. © S&P Dow Jones Indices LLC 2016. S&P® is a registered trademark of S&P Financial Services LLC. Dow Jones® is a registered trademark of Dow Jones Trademark Holdings LLC. S&P Dow Jones Indices LLC is not an investment advisor. This publication is not a recommendation by S&P Dow Jones Indices to buy, sell, or hold a security, nor is it considered to be investment advice.
Copyright © S&P Dow Jones Indices


