For this week’s edition of the Equity Leaders Weekly, we are going to examine SIA’s #1 asset class, US Equity. The US Equity Asset class entered the #1 spot in our Asset Class Ranking on November 24 of last year during which time the Nasdaq Composite Index has increased by over 9.6%. The last time we commented on this index was in the January 12th edition of the Equity Leaders Weekly. Hence, we will provide an update on how the Nasdaq Composite Index (NASD.I) has performed after it broke above new all-time high territory late last year. We are also going to examine how the Copper Commodity (HG.F) has performed with the continued strengthening in the equity markets of late with US Equity, International Equity, and Canadian Equity all occupying the top 3 spots in the SIA Asset Class Rank list respectively.
Nasdaq Composite Index (NASD.I)
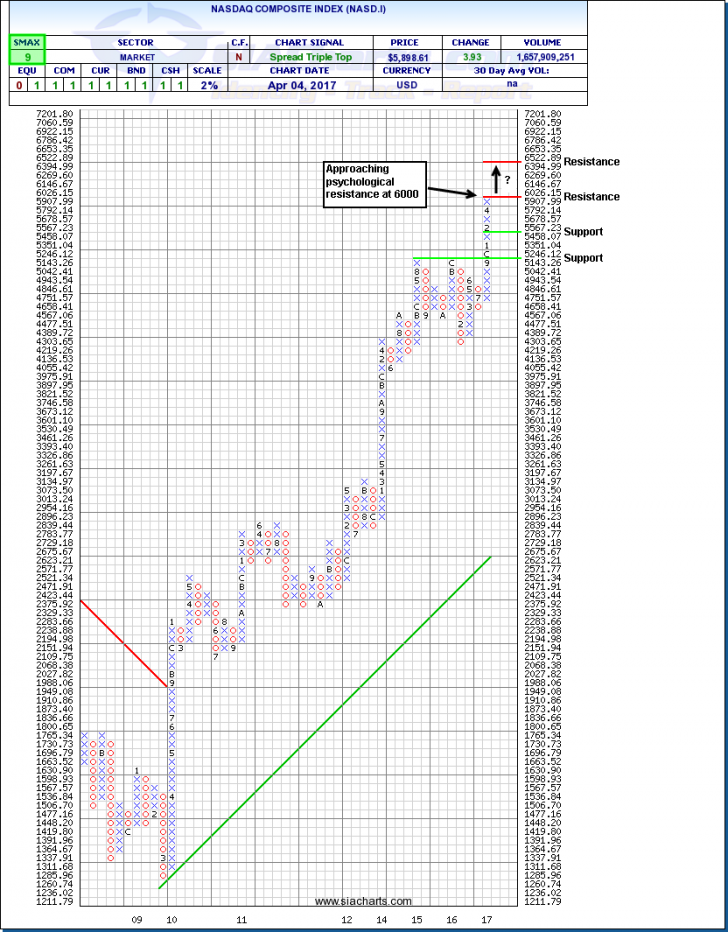
With the current US administration’s pro-growth plans of lower taxes, more infrastructure spending and less regulation we have seen the US equity markets in all-time high territory. In addition to these economic friendly initiatives, we have also seen positive payroll numbers continue to materialize in the US as the March Private Sector Payrolls grew 263,000 versus a 185,000 expectation among economists surveyed by Reuters. These factors have continued to buoy the US equity market to all-time high status. Lets look at the attached chart of the Nasdaq Composite Index (NASD.I) to see what may lie ahead for the index in the coming weeks. Support for the Nasdaq can now be found at the 3-box reversal mark of 5458.07. The next level of support below that, is 5143.26 which is the level prior its current break out to new highs. It is quickly approaching some phychological resistance at 6000. If it manages to break above this psychological resistance, the next level of resistance is at 6522.89. With the upcoming meeting between President Trump and Chinese President Xi Jinping for the first time today and Friday the markets seem anxious to see what the possible outcomes of these meetings may be. It will be interesting to see, after these meetings, if we get continued follow through above the psychological 6000 resistance level. The Nasdaq currently has a SMAX Score of 9 out of 10 showing near term strength against most asset classes.

High Grade Copper Continuous Contract (HG.F)
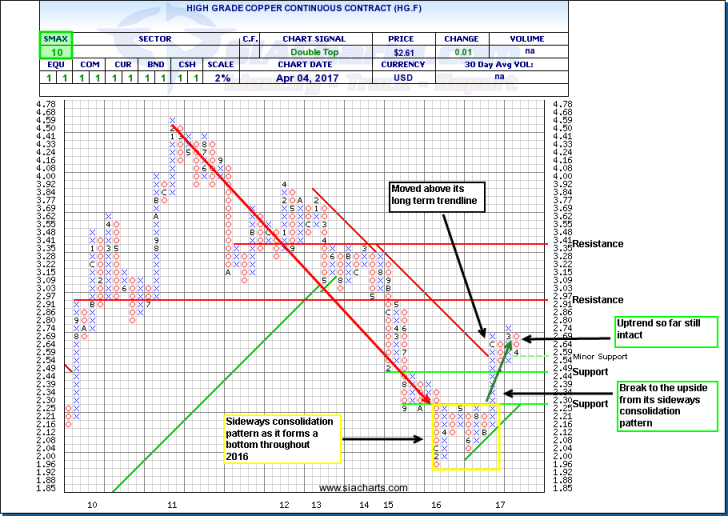
With the pro-growth stance the US administration has embarked on, and US Labor market conditions remaining quite strong, let’s examine if Copper’s reputation of being referred to as Dr. Copper is holding true to its stigma of being a leading economic proxy. It is so often viewed as an indicator of economic health by economists. The last time we looked at Copper was in a little over a month ago when it had just broken above it’s long term trend line. In looking at the attached chart, we see the price of copper is still above its long-term trend line. However, most recently a 3-box reversal has materialized with a column of O’s. But most interesting, the uptrend from the bottom it formed for the better part of 2016 is still intact today. It is currently at support at the 3-box reversal of $2.54 and, below that, stronger support at $2.44. Resistance is now at $2.97 and, above that, $3.41. With an SMAX of 10 out of 10, it is currently showing near term strength against all asset classes.

SIACharts.com specifically represents that it does not give investment advice or advocate the purchase or sale of any security or investment. None of the information contained in this website or document constitutes an offer to sell or the solicitation of an offer to buy any security or other investment or an offer to provide investment services of any kind. Neither SIACharts.com (FundCharts Inc.) nor its third party content providers shall be liable for any errors, inaccuracies or delays in content, or for any actions taken in reliance thereon.
For further discussion on this relationship and what it means for your portfolios, you can contact our customer support at 1-877-668-1332 or siateam@siacharts.com.
Copyright © SIACharts.com


