by Ryan Detrick, LPL Research
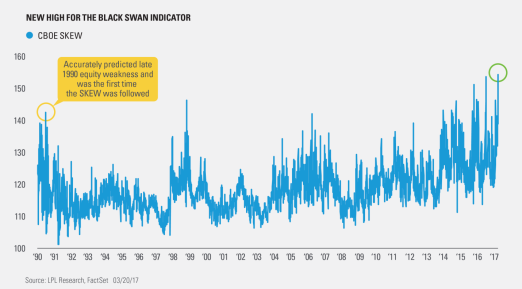
Friday, March 17 was a historic day, as the CBOE SKEW Index hit an all-time high. This index looks at S&P 500 Index tail risk and is calculated by how much investors are willing to pay to be hedged. When demand to be hedged increases, there is more perceived tail risk* that something bad could be about to happen. In simpler terms, the cost of protecting against a major event (called a Black Swan) is now at a record. You can read more on CBOE.com.
This indicator shot to fame in 1990, as it soared to a record above 140 in June of that year just ahead of Iraq invading Kuwait and the subsequent pullback in the S&P 500 of nearly 20% the following four months. Typically, the SKEW ranges between 100 and 150, which makes the 154 it registered on Friday all the more unique. As this gets closer to 150, that is the market’s way of saying that an event of more than two standard deviations could be on the horizon. Remember that a “standard deviation” is a mathematical term that explains how likely an event is to deviate from the average. An event of more than two standard deviations, statistically speaking, would have only a 5% chance of occurring normally.
Now, here’s the catch. This indicator has been elevated recently, as the SKEW has averaged more than 135 in 2017, the most ever for one single year. The past few years have all seen a historically high SKEW in fact. It is worth noting though, historically when volatility is low (measured by the CBOE Volatility Index [VIX]), like now, the SKEW tends to be higher. So with historically low volatility, a higher SKEW shouldn’t be such a surprise.
Per Ryan Detrick, Senior Market Strategist, “The Black Swan indicator might be at new highs, but this by itself isn’t always a major warning sign. In fact it has made a new high four times since 1990: October 1998, October 2015, June 2016, and last Friday. There was weakness after the October 2015 signal into the February 2016 lows (the S&P 500 was 14% off the highs), but the S&P 500 was still higher six months later in all three instances with an average return of more than 12%.”
*****
IMPORTANT DISCLOSURES
*Tail risk is a technical measure of portfolio risk that arises when there is an increased probability that an investment will experience a price swing much larger than it would be expected to under normal conditions. Tail risks include market events that generally would have a small chance of occurring.
Past performance is no guarantee of future results. All indexes are unmanaged and cannot be invested into directly.
The opinions voiced in this material are for general information only and are not intended to provide or be construed as providing specific investment advice or recommendations for any individual security.
The economic forecasts set forth in the presentation may not develop as predicted.
Investing in stock includes numerous specific risks including: the fluctuation of dividend, loss of principal and potential illiquidity of the investment in a falling market.
Stock investing involves risk including loss of principal.
The S&P 500 Index is a capitalization-weighted index of 500 stocks designed to measure performance of the broad domestic economy through changes in the aggregate market value of 500 stocks representing all major industries.
The VIX is a measure of the volatility implied in the prices of options contracts for the S&P 500. It is a market-based estimate of future volatility. When sentiment reaches one extreme or the other, the market typically reverses course. While this is not necessarily predictive it does measure the current degree of fear present in the stock market.
This research material has been prepared by LPL Financial LLC.
To the extent you are receiving investment advice from a separately registered independent investment advisor, please note that LPL Financial LLC is not an affiliate of and makes no representation with respect to such entity.
Not FDIC/NCUA Insured | Not Bank/Credit Union Guaranteed | May Lose Value | Not Guaranteed by any Government Agency | Not a Bank/Credit Union Deposit
Securities and Advisory services offered through LPL Financial LLC, a Registered Investment Advisor Member FINRA/SIPC
Tracking #1-592405 (Exp. 3/18)
Copyright © LPL Research


