Avoiding the equity income “dividend trap”
by Thomas Boccellari, Fixed Income Product Strategist, Invesco PowerShares Capital Management LLC, Invesco Canada
Income-oriented stocks can provide investors with numerous advantages – including the potential for high, recurring income, a possible inflation hedge and added portfolio diversification. And while diversification does not ensure a profit or protect against loss, dividend stocks can serve as a significant source of investment returns. In fact, over the past two decades, dividends have contributed more than 40% to S&P 500 Index investors’ total returns.1
In today’s low interest rate environment, investors are seeking yield anywhere they can, and high-yielding dividend stocks may seem like an ideal solution. But these same investors may inadvertently be wandering into a dividend trap.
Beware “dividend traps”
A dividend becomes a trap when investors are lured by high dividend yields that are misleading or not sustainable. For example, a company’s stock price may be in decline because of financial struggles, which may cause a company’s management to rethink future dividend payments. Dividends are often paid out quarterly, however, and unsuspecting investors can be trapped by taking a position in the stock before the dividend has actually been cut.
The following chart illustrates one such scenario. Note that this Company A’s dividend remains robust for more than a year after the company’s stock price begins falling. During this time, investors lured by the promise of high yields may buy the company’s stock, only to see the dividend slashed.
Dividend trap #1: High dividend and falling share price
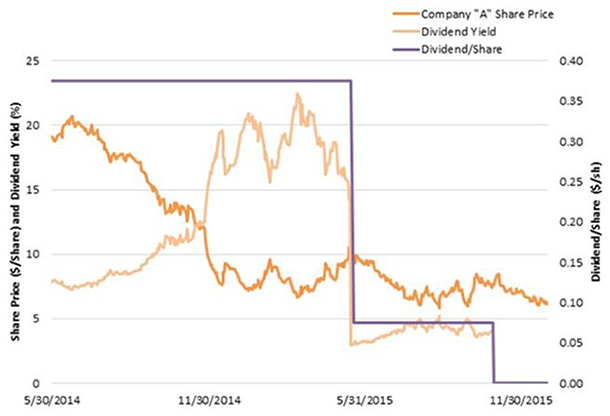
Source: Bloomberg L.P., March 10, 2017. For illustrative purposes only. Past performance is no guarantee of future results.
Dividend yields may also appear attractive because the company’s stock price is falling – not because of increased dividend payouts. Dividend yields are calculated as a percentage of a company’s stock price. Thus, when the denominator (stock price) is falling, dividend yields can be artificially inflated. Falling stock prices rarely bode well for future dividends. By taking a position in a volatile issuer with a declining share price, investors may be entering a dividend trap.
In the chart below, note that the dividend yield mirrors Company B’s falling stock price – rising as the company’s share price declines. Note also that the stock’s dividend yield is at its peak just before the company slashes its dividend by 80%, before eliminating it altogether.
Dividend trap #2: Dividend yield peaking before dividend cut
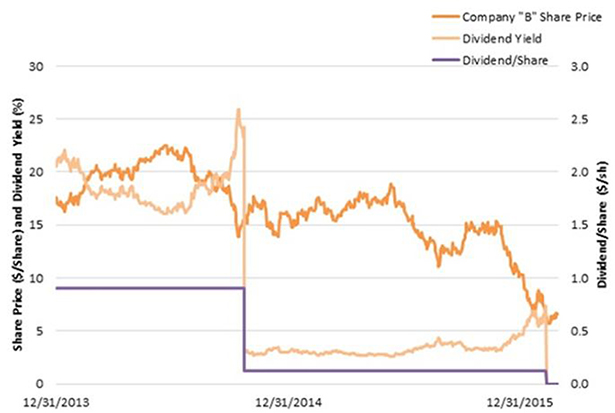
Source: Bloomberg L.P., March 10, 2017. For illustrative purposes only. Past performance is no guarantee of future results.
Avoiding dividend traps
In order to avoid dividend traps, investors may opt for dividend-grower stocks. These are dividend-paying stocks whose issuers have a history of increasing dividends on a regular basis. Even with rising dividends, however, dividend-grower yields aren’t always especially attractive – particularly in a low-yield environment in which the Bloomberg Barclays US Aggregate Bond Index is yielding less than 2.6%.1
Fortunately, we believe there is one way to reduce the possibility of dividend traps without sacrificing yield potential – the addition of a low volatility screen. By using a low volatility screen, investors may be able to generate high current income while avoiding dividend traps that can sink an investor’s portfolio. The chart below shows the 12-month dividend yield and three-year annualized volatility for a variety of dividend strategies. Over this three-year period, the high dividend, low-volatility strategy generated high current income while reducing volatility relative to other dividend strategies and the S&P 500 Index.
Equity dividend strategies compared: Sept. 16, 2012 – Feb. 28, 2017
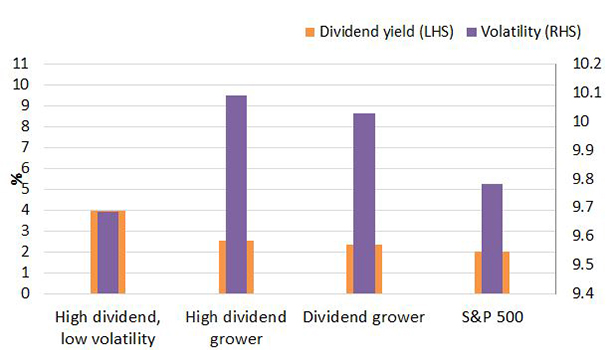
Source: Bloomberg L.P., as of Feb. 28, 2017. Past performance is no guarantee of future results. High Dividend Low Volatility, High Dividend Grower, Dividend Grower and S&P 500 are represented by the S&P 500 Low Volatility High Dividend Index, S&P 500 High Yield Dividend Aristocrats Index, S&P 500 Dividend Aristocrats Index and S&P 500 Index, respectively. Volatility is represented by standard deviation of monthly total returns. Index performance does not reflect the performance of the PowerShares S&P 500 High Dividend Low Volatility Index ETF (UHD). All data is displayed in U.S. dollars unless otherwise noted.
This post was originally published at Invesco Canada Blog
Copyright © Invesco Canada Blog