
by Lance Roberts, Clarity Financial
The month of March typically marks the beginning of Spring. This weekend will also mark the loss of an hour of sleep as we set our clocks forward an hour in observance of daylight savings time.
As we will discuss momentarily, the month of March begins following an unseasonably warm winter period that allowed for manufacturing activity to occur during a period where inclement weather normally abounds. This is an interesting point because two years ago, the BEA adjusted the “seasonal adjustment” factors to compensate for the cold winter weather over the previous couple of years which had suppressed first quarter economic growth rates. (The irony here is that they adjusted adjustments for cold weather that generally occurs during winter.) However, the problem with “tinkering” with the numbers comes when you have an exceptionally warm winter. The new adjustment factors, which boosted Q1 economic growth during the last two years now creates a large over-estimation of activity during the first quarter of a year where winter weather is unseasonably warm.
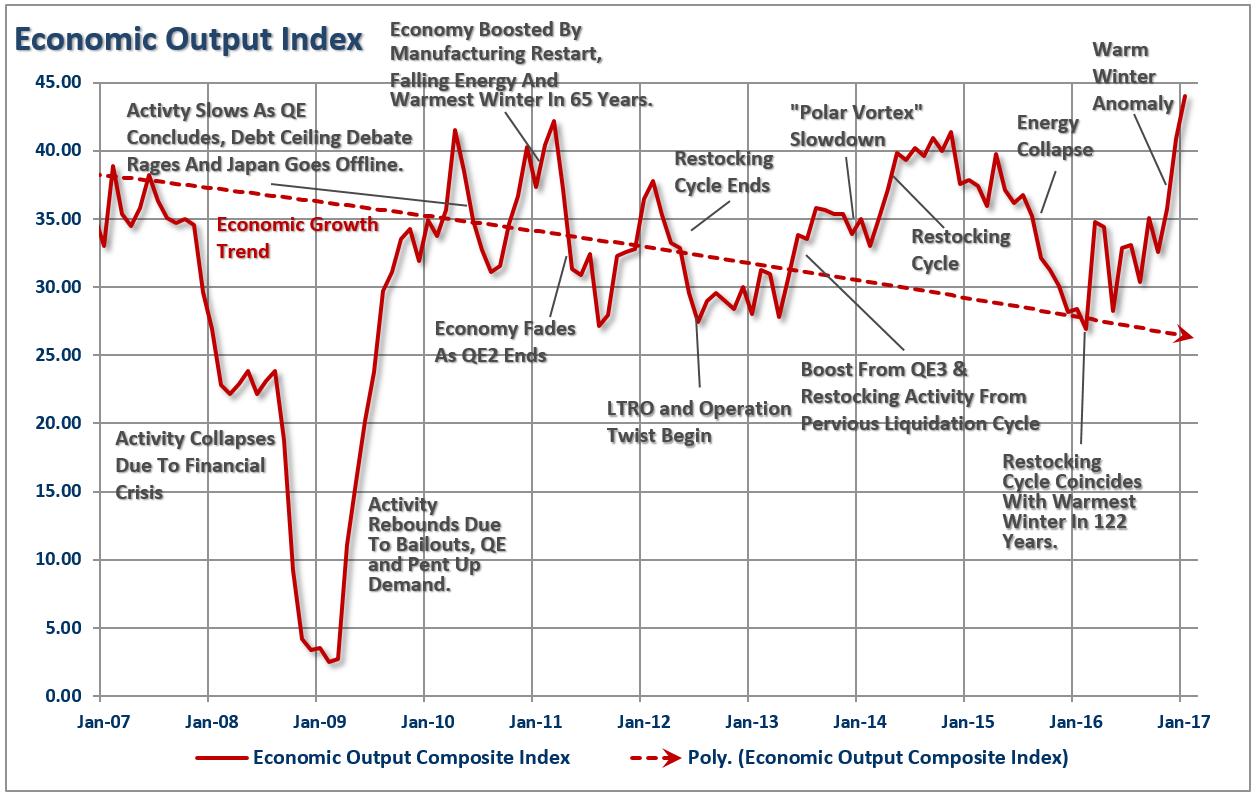
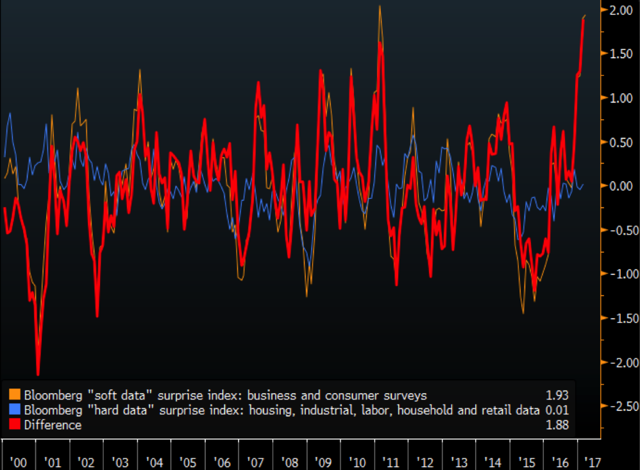
This anomaly has boosted “bullish hope” as the fear of an economic slowdown has been postponed. At least temporarily until the over-estimations are revised away over the course of the coming months. Of course, with the spread between “hope” and “reality” currently at some of the highest levels ever, it is worth paying attention to what happens.
However, as of now, the bullish underpinnings of the markets remain.
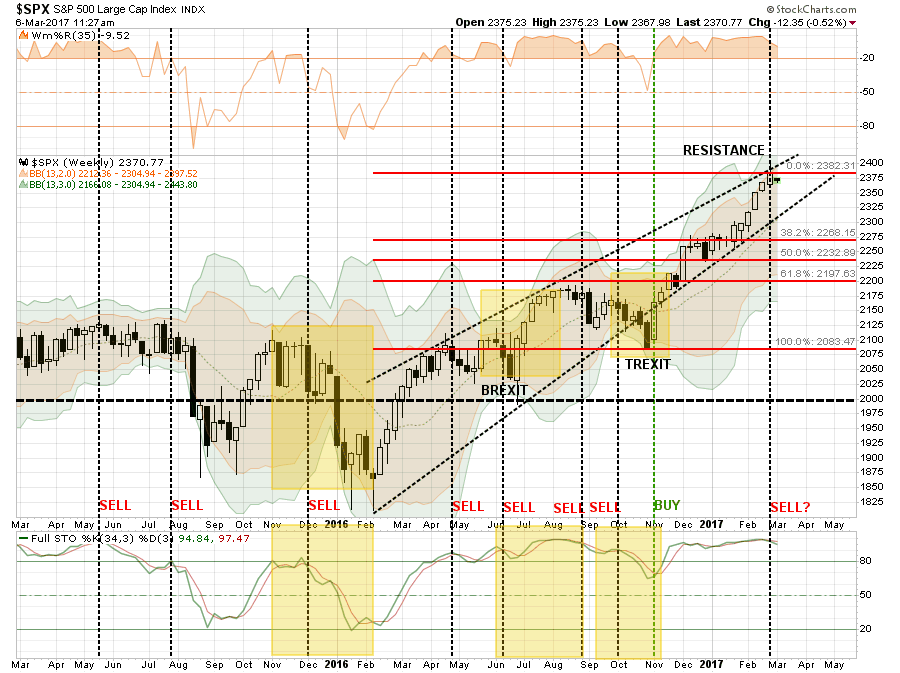
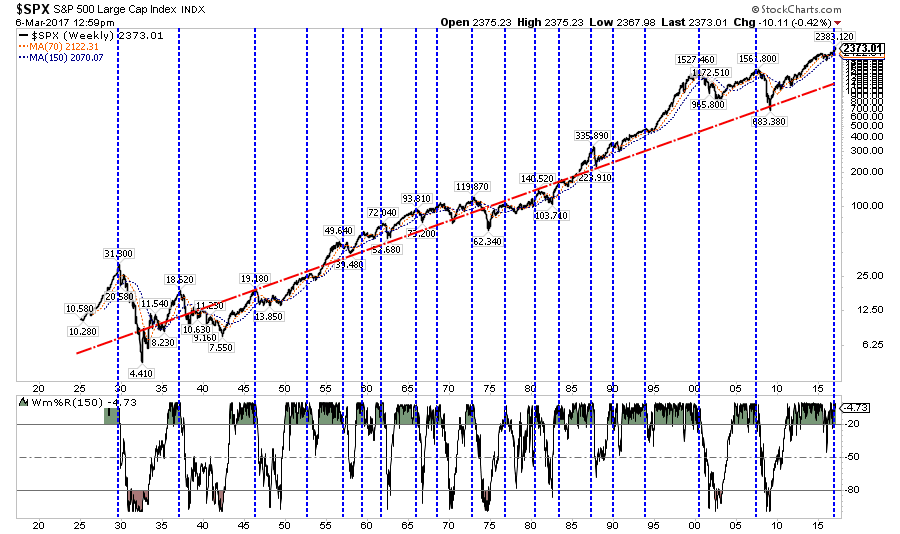
The rising dashed lines show the bullish trend of the market currently which suggests that a short-term pullback towards 2325 is likely.
The bad news comes from the overbought/oversold indicators again as we head into March. The oversold condition that existed at the beginning of 2016 has been completely exhausted due to the post-election rally. This leaves little ability for a significant rally from current levels and makes a substantial push higher unlikely. Just as an oversold condition provides the necessary ‘fuel’ for an advance, the opposite is also true.
As noted, we are potentially registering an early “sell signal” from a very high level which suggests a potential retracement over the next month to between 2200 and 2275 on a Fibonacci retracement scale. Such a pullback, provided critical support levels are not broken, would likely provide for a tradeable rally through the end of the “seasonally strong” period.
Importantly, the trend of the market is still positive, therefore, all pullbacks should remain confined within the overall positive trend. That is…until it eventually changes.
The rules here are very simple:
- In rising market trends – buy dips.
- In declining market trends – sell rallies.
The Ides Of March
For basketball fans, the month of March brings a lot of excitement as the NCAA heads into their annual tournament. This month also brings the Dutch elections, a Fed rate hike announcement, and a potential “debt ceiling” debate. Any of those last three issues alone could roil the markets, let alone a combination of any two, or all, of them. Furthermore, after a positive return in both January and February, it is hoped that March will be able to continue to the trend.
Now, I realize analyzing market data isn’t as fun as basketball teams, but since you are investing your hard earned savings, it is an exercise worth undertaking.
So, let’s dig into the monthly statistics for March to get a better understanding of what we should expect.
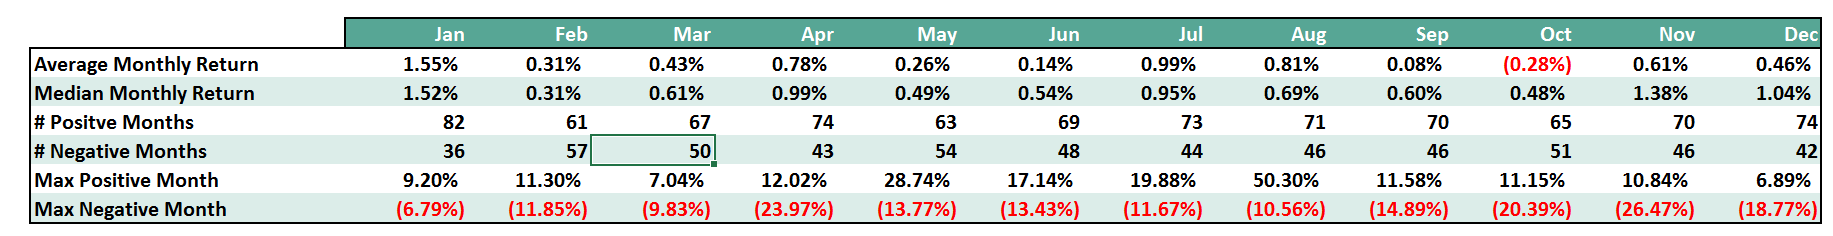
Beginning with the “big picture” perspective, the average and median monthly returns for March have not been terrifically exciting and only slightly better than what we would have expected for February.
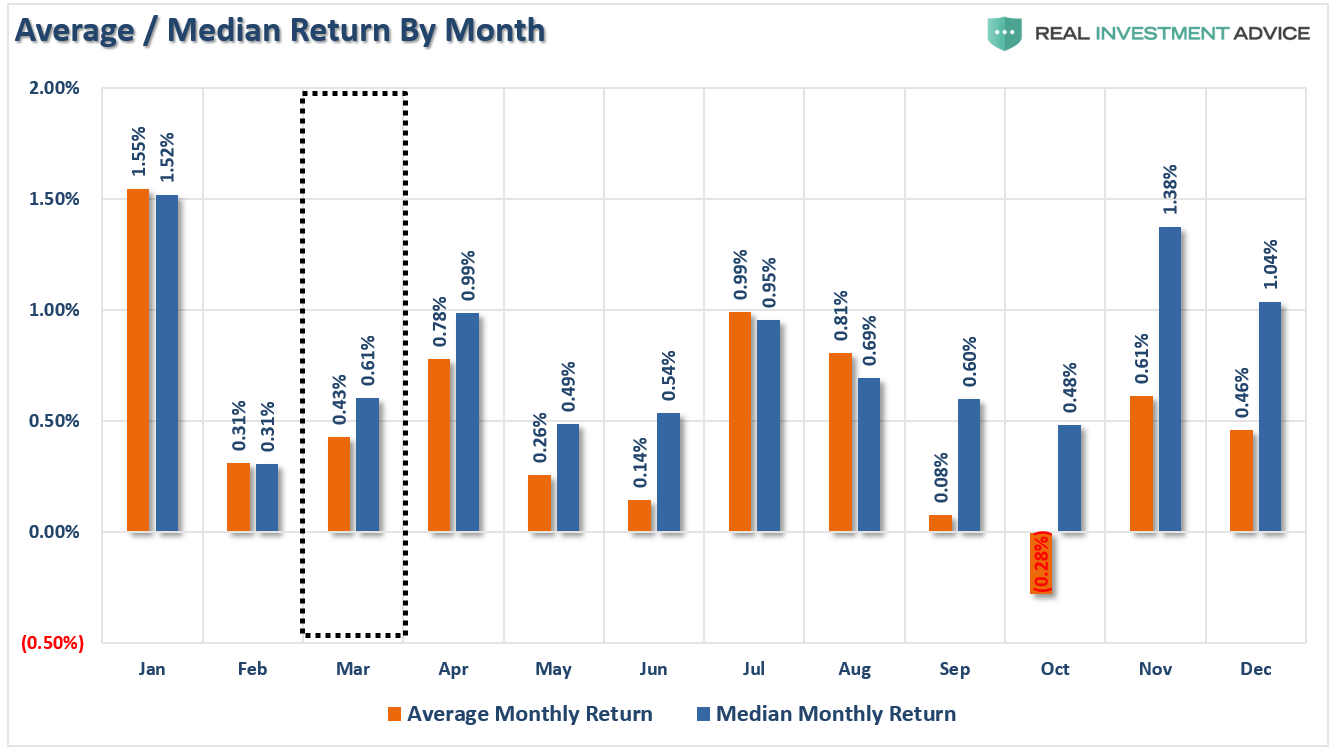
However, given that both January and February were positive months, which has occurred 50-times since 1900, the following March month was positive only 29-times.
Of course, what averages and median returns obfuscate are the months when things go exceptionally well and horribly wrong. The next chart displays the best and worst return in March historically.
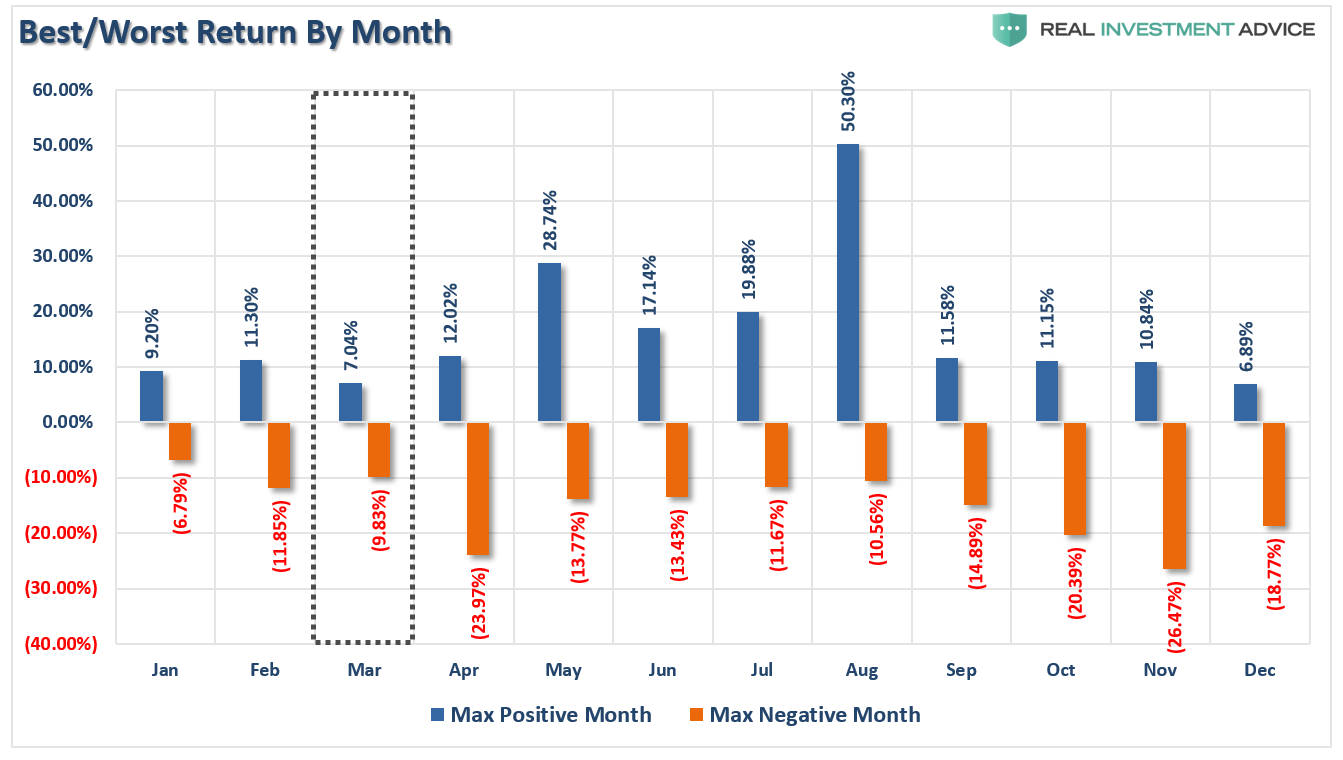
March has had some big positive return months like 2016’s near 7% gain that almost matched the historic record. It has also had some whopper losses. We can see the entire distribution of returns below.
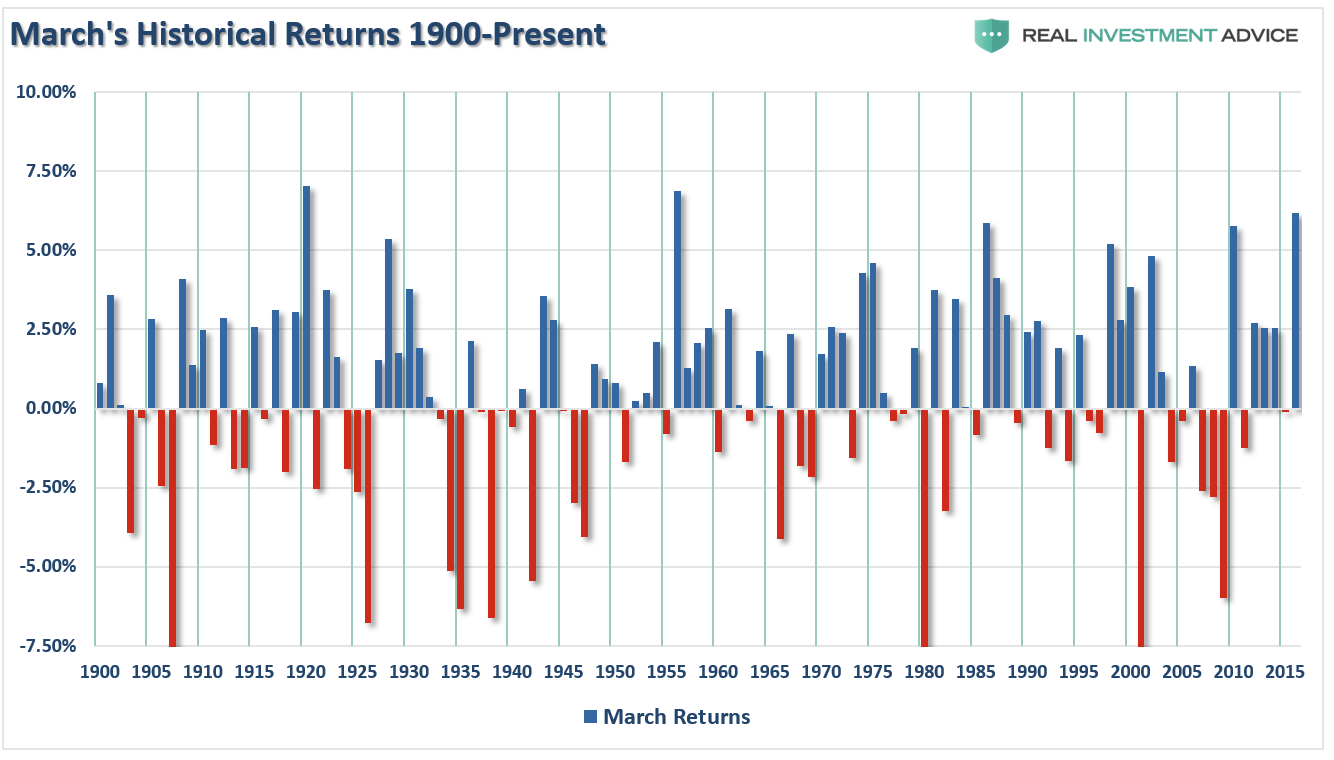
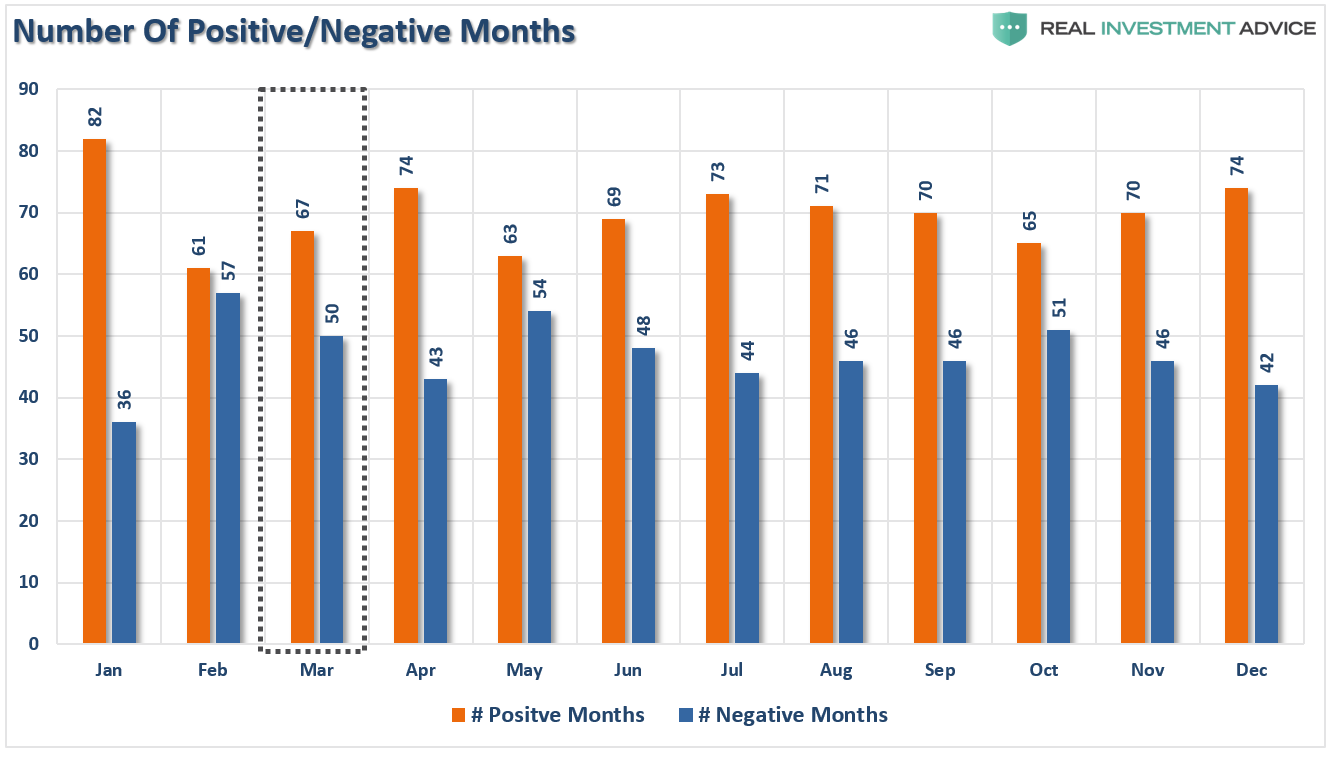
What we now see more clearly is there are many times that March yields negative rates of return for the month. Since 1900, March has delivered 67 positive months and 50 negative months, giving March a winning percentage of 57.2%. While a little better than a coin toss, it’s not by much.
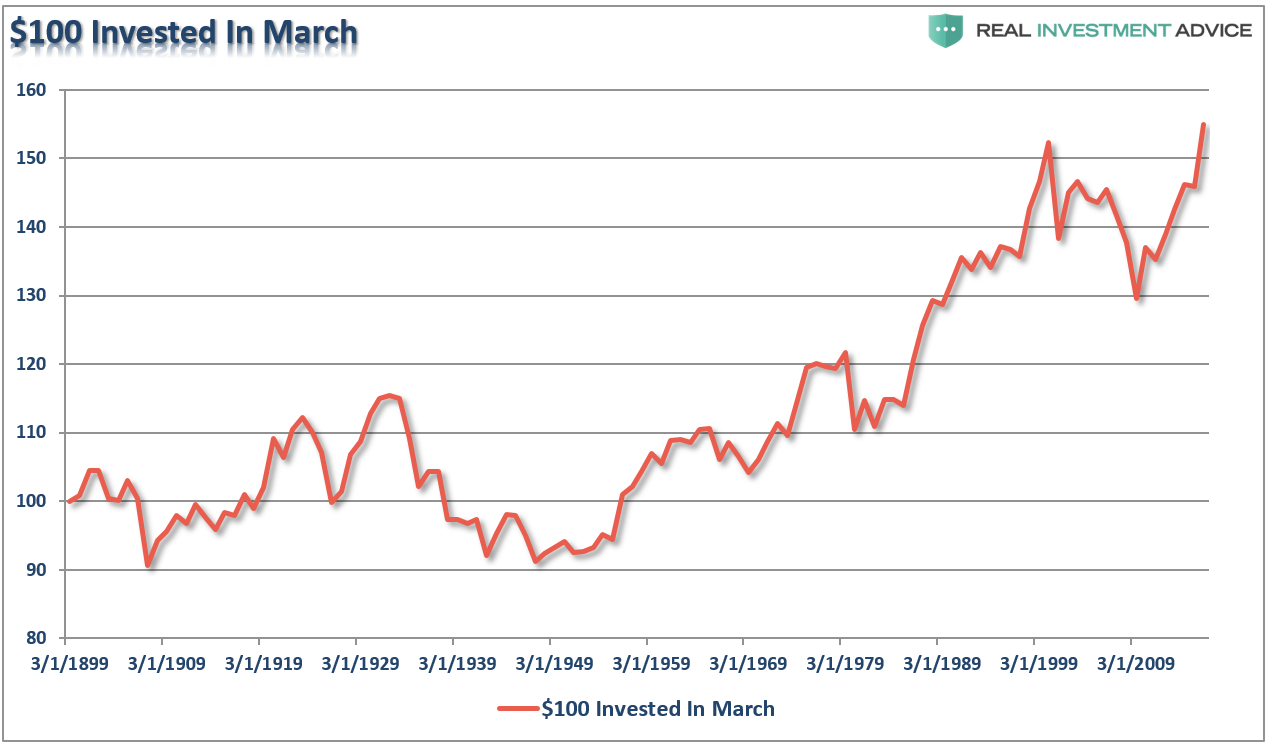
Since February has typically been a weak performance month for stocks, historically speaking, the month of March has often been a rebound month. This has led to March typically having stronger performance over time. The chart below shows the impact of $100 invested only in the month of March.
While the backdrop currently remains bullishly biased, and argues for maintaining long-biased exposure in the markets, we did take some profits off of the table last week to rebalance portfolio risk.
I have to agree with Jeff Saut’s recent commentary as well wherein he stated:
“In the short term, we do not understand what is going on. Consequently, when we do not understand the current market environment, we tend not to play.”
There are many pieces of evidence which suggest the current market meltup is very akin to what we have seen near previous major corrective market tops in the past. Such price action suggests that overall portfolio risk should be carefully monitored and reduced to more risk-managed levels.
As noted by Business Insider recently, again quoting Jeff Saut:
“Corporate insiders sold $7.8 billion of their companies’ stock in February, which was the most in roughly six years.
What do they know that we don’t know? Maybe they know that the Daily Sentiment Survey of Futures Traders shows a 92% Bulls reading. In the three times the reading has been that high since 2011 it has led to declines of 7% (2/11), 8% (5/13), and 3% (11/13). Also of note is that late last week the number of stocks making new 52-week highs on the NYSE collapsed by some 80%.
Then there are the bullish sentiment figures that are at danger levels. All of this continues to leave us in a cautionary stance despite the fact that stance has been wrong for three weeks.“
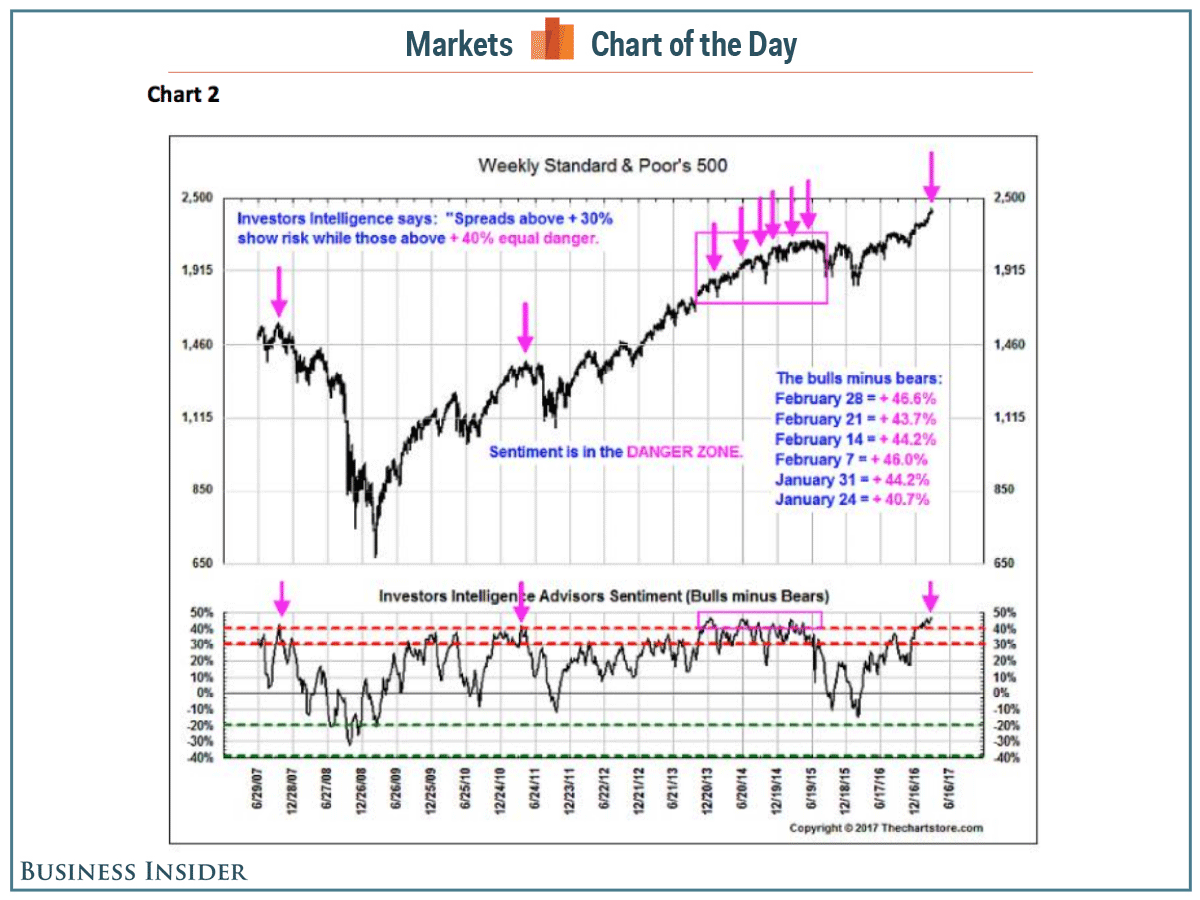
This is the problem with exuberance. It can defy logic much longer than expected, however, it is exactly when investors capitulate into the “this is never going to stop going up” mentality…that it does.
The market is as severely overbought as it has been at every other major market peak throughout history. While it does take “time” for these types of bullish advances to end…they eventually do.
Of course, throughout history, it has been the Fed hiking rates that have eventually done the trick.
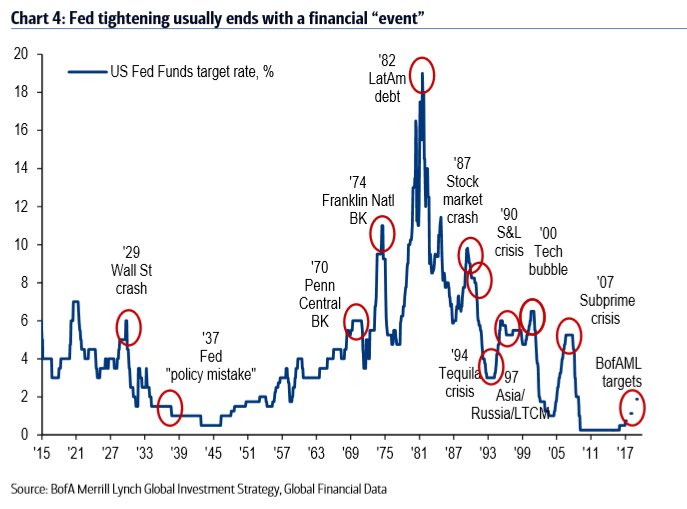
As stated above, with the Fed on deck to raise rates, Geo-political election risk as the Eurozone seemingly continues to break apart, and the debt-ceiling hitting its limit all at mid-month, being a bit more cautious temporarily may well pay off.
While many have suggested that investors should “buy and hold” investments and just ride them out over the long-term, that is just half the story. J. Paul Getty provided the full definition of “buy and hold” investing:
"Buy when everyone else is selling and hold until everyone else is buying. This is the very essence of successful investing." - J Paul Getty
— Lance Roberts (@LanceRoberts) February 27, 2016
It is unfortunate that some many have forgotten what “investing” actually means. Given that investors have piled into the market since the beginning of the year, the question simply becomes who is doing the selling?
Copyright © Clarity Financial