
by Benjamin Streed, CFA, Fixed Income, Raymond James
Mark your calendars for next Wednesday the 15th (aka the Ides of March when the Fed will announce what is seemingly becoming a guaranteed rate hike. This would mark the fastest pace of a rate hike in the post-recession world, as the committee has only hiked once per year in each of December 2014 and 2015. Although members of our central bank have hinted that is less about the “pace” and more about the “path” of future rate hikes, the markets are seemingly convinced that we will shortly be on course for “faster and quicker”. Interestingly enough, since the last rate hike the markets have pushed up the front end of the yield curve (reflecting the increasing fed funds rate) yet simultaneously pushed down the back end. According to Bloomberg futures data, there is now an ~94% chance the Fed hikes rates by a quarter point (0.25%) in mid-March, yet the bond markets don’t seem to be bothered by the prospect of higher rates on the front-end of the curve.
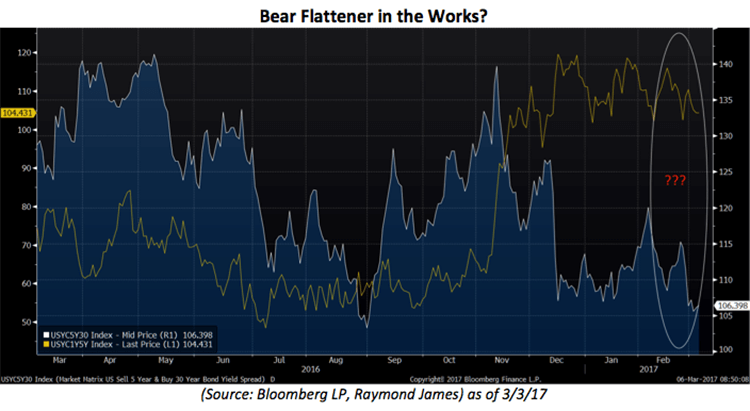
As you can see from the chart above, the 1-5yr portion of the US Treasury curve has steepened (yellow, left) as prospects for a rate hike are all but certain, yet the same rationale for the hike: higher wages, job growth, economic expansion and rising inflation, don’t seem to matter much to the longer-term trend five to thirty years out (blue, right). In fact, since the Fed’s last hike in December rates <2yrs to maturity are higher yet every other maturity is lower in yield. Considering some of the discussions out of Washington are indicating that any pro-growth initiatives may take until late 2018 to show up in the data, it could make some sense that the yield curve is willing to go along with this thesis and push near-term yields higher, but remain wary of any long-term effect these could have. By the time we see any effects of these policies we’ll have to deal with mid-term elections as well as the beginnings of the next presidential campaigns.
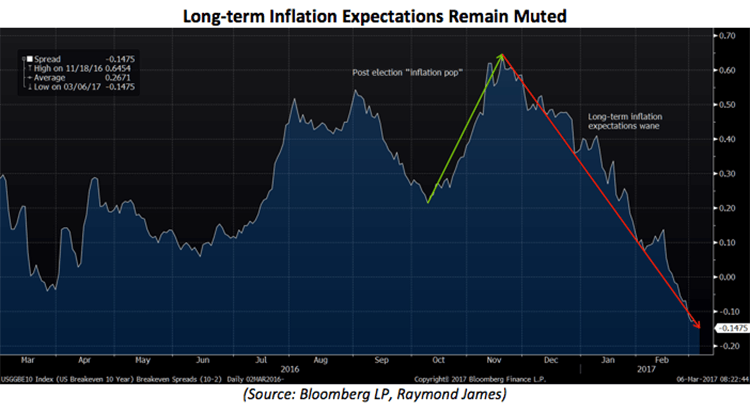
Furthermore, the post-election “reflation” trade has faltered despite the more hawkish (pro-hike) rhetoric out of the Fed. Rates moving up should indicate a healthy economy that can support broadly higher levels of interest rates, yet markets see much of the pro-growth fiscal policies out of Washington proving only a temporary boost before moving back towards their longer-term trend levels. The chart below is the spread (difference) between 10yr and 2yr inflation breakeven points. As a reminder, the breakeven point is a measure of inflation expectations compared to a nominal Treasury security. If the 10yr breakeven rate is 2%, it would mean that investors in inflation-linked bonds would be better off than a similar maturity fixed-rate bond if inflation averaged >2% of the life of the instrument. By comparing the two measures here, both short and long-term, we can get a better understanding of the timeline for inflation expectations. Currently at negative 0.14%, markets are saying that inflation in the coming years is likely to be higher than the long-term trend, which will likely have a lot to do with the current presidential agenda.
Copyright © Raymond James