For this week’s edition of the Equity Leaders Weekly, we are going examine the US Equity market which is ranked first in SIA’s Asset Class Ranking since November 24 of last year during which time the US Equity markets have increased by over 8.5%. We will revisit how the Dow Jones Industrial Average (DJI.I) has performed after it broke above the psychological 20,000 barrier late in January. We are also going to examine how the Copper Commodity (HG.F) has performed with the continued strengthening in the equity markets of late with US Equity, International Equity, and Canadian Equity all occupying the top 3 spots in the SIA Asset Class Rank list respectively.
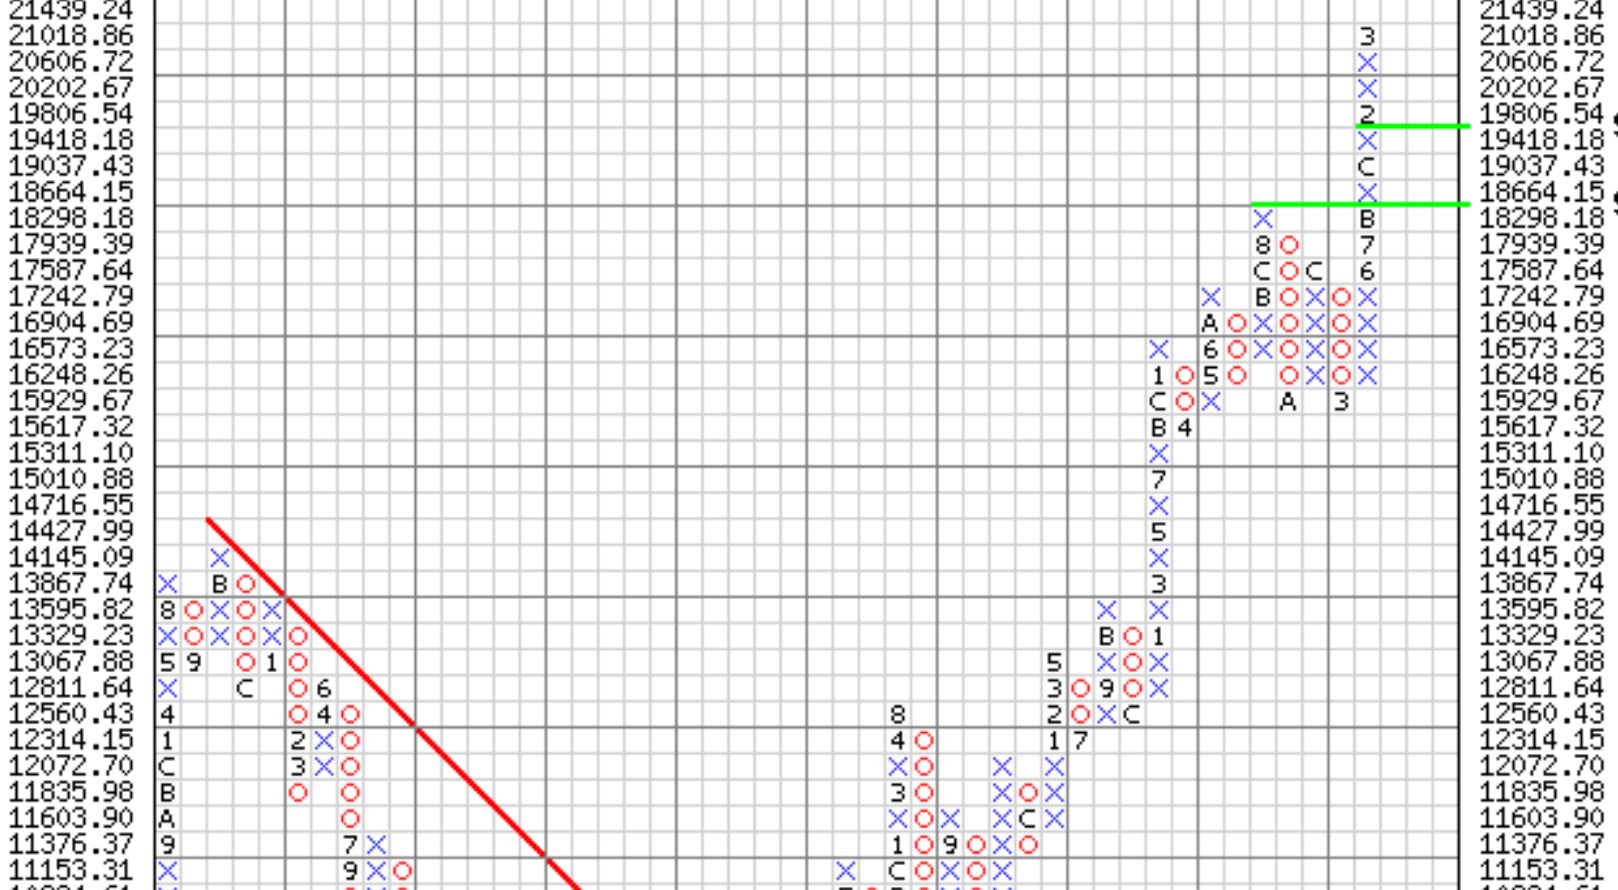
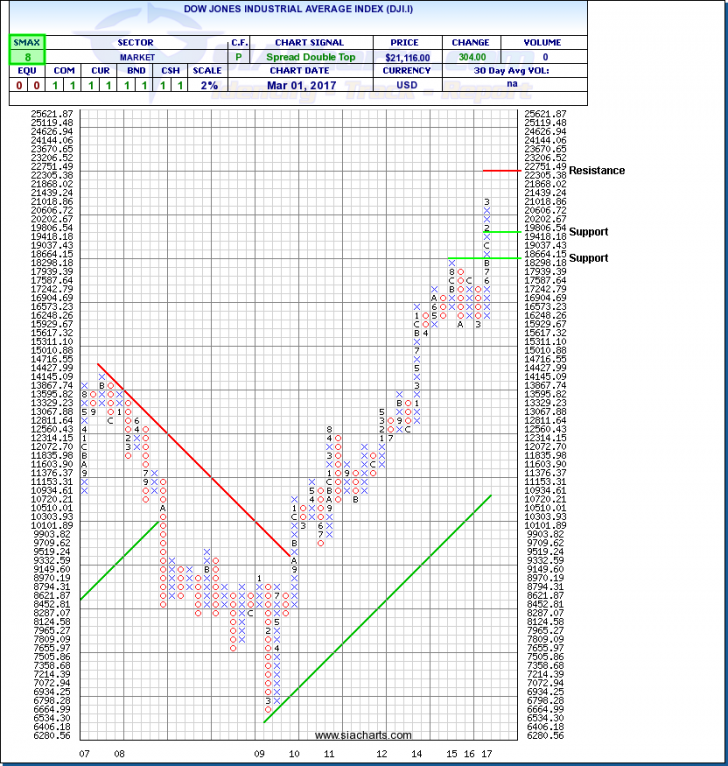
Dow Jones Industrial Index (DJI.I)
Donald Trump has spoken to Congress on Tuesday in his first public address to the joint session after his inauguration. In his speech, he had pledged to boost the economy with massive tax relief for the middle class as well as tax cuts to corporate America. He plans to boost infrastructure spending by an amount of US $1 Trillion and will drastically increase military spending by over $54 Billion as well. These initiatives helped boost his stand on economic growth which has buoyed US equity markets to all-time highs since the election. Keeping with his 'America First' rhetoric, a key area to watch for is future policy changes to international trade agreements as well.
Let looks at the attached chart of the Dow Jones Industrial Index (DJI.I) to see what may lie ahead for the index in the coming months. Support for the Dow can now be found at the 3-box reversal mark of 19,418. The next level of support below that is 18,298. With the Dow in new all-time high territory above the 21,000 mark now, the new level of resistance can be found at the 22,751 area. With the Dow closing at a record high for 12 consecutive days over the last few weeks, this was the longest winning streak for the 30-company average in over 30 years. The Dow currently has a SMAX Score of 8 out of 10 showing near-term strength against most asset classes.
Click on Image to Enlarge
High Grade Copper Continuous Contract (HG.F)
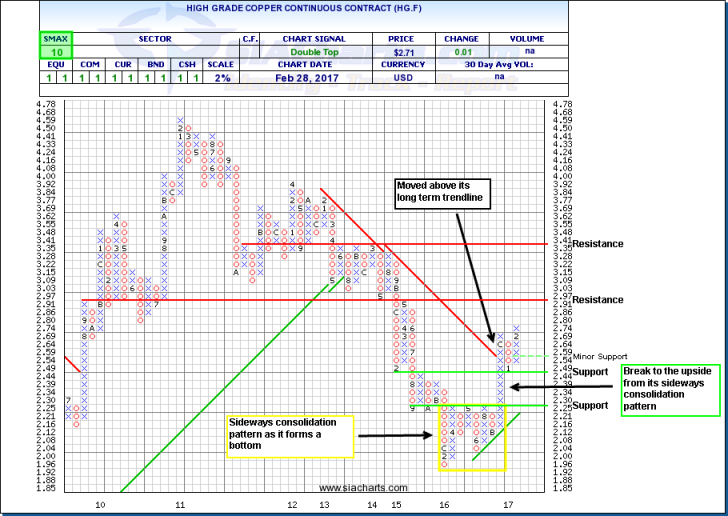
With the pro-growth stance the US administration has embarked on and with the Bank of Canada keeping interest rates steady at 0.5% on Wednesday, we have seen the equity markets on both sides of the border remain strong in Wednesday’s trading. Copper’s reputation of being referred to as 'Dr. Copper' is holding true to its stigma of being a leading economic proxy, which is often viewed as an indicator of economic health by economists. The last time we looked at Copper was in the Dec. 22, 2016 edition of the Equity Leaders Weekly when it had just broken above its long-term trend line.
In looking at the attached chart, we see the trend to the upside has continued to materialize. After a slight pullback in January when it reversed into a small column of O’s, we see that a new column of rising X’s has formed and the uptrend from the bottom has formed for the later part of 2016 and now into 2017. Resistance can now be found around the $3 mark at $2.97 and above this at $3.41. There is minor support at $2.54 and below that, stronger support is found at $2.44. With an SMAX of 10 out of 10, it is currently showing near- term strength against all asset classes.
For a more in-depth analysis on the relative strength of the equity markets, bonds, commodities, currencies, etc. or for more information on SIACharts.com, you can contact our sales and customer support at 1-877-668-1332 or at siateam@siacharts.com.
Click on Image to Enlarge
SIACharts.com specifically represents that it does not give investment advice or advocate the purchase or sale of any security or investment. None of the information contained in this website or document constitutes an offer to sell or the solicitation of an offer to buy any security or other investment or an offer to provide investment services of any kind. Neither SIACharts.com (FundCharts Inc.) nor its third party content providers shall be liable for any errors, inaccuracies or delays in content, or for any actions taken in reliance thereon.
Copyright © SIACharts.com