
This week in the SIA Equity Leaders Weekly, we are going to take another look at the Crude Oil Continuous Contract (CL.F) after hitting it highest level in 18 months on Tuesday. There are many views on which way oil prices are heading with some believing $30 is in the cards again but the majority possibly seeing a collared range between $50 and $60 a barrel, a range that both governments and private producers alike have indicated they could live with. In our second chart, we will explore the relationship between both CL.F and the Canadian energy equity space. Specifically we will look at CL.F relative to the iShares S&P/TSX Capped Energy Index ETF (XEG.TO).
Crude Oil Continuous Contract (CL.F)
Although we witnessed a sell off in oil prices Wednesday, Tuesday was all about the upside with prices reaching levels not seen for over 18 months. CL.F ended about 1 percent higher on Tuesday on OPEC’s optimism for greater compliance with its deal with other producers, including Russia, to curb output in an effort to clear a glut that has weighted on the market in recent years. OPEC made mention at a conference in London that January data showed conformity from participating OPEC nations with output curbs being above 90% and with the potential of oil inventories declining further this year.
Looking at the chart of CL.F, we can see that the major change between today’s price action and the last time we covered CL.F on Jan 18, 2017, is that the falling column of O’s reversed off of support at $49.85 and continued higher to our first level of resistance at $55.04. The question now is, will prices stay range bound between the $50 and $55 level, or will we see a breakout to either the upside, finding resistance $61.99 or the downside finding support at $46.06? Keep a close eye on this breakout and this chart to help understand the possible future trends.
Click on Image to Enlarge

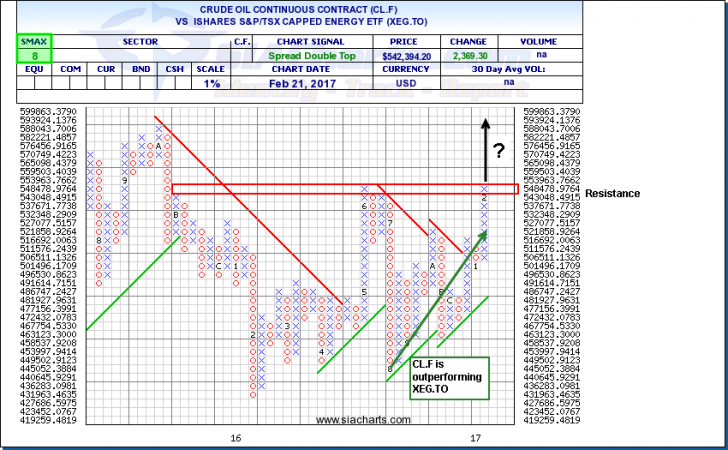
Crude Oil Continuous Contract (CL.F) VS iShares S&P/TSX Capped Energy ETF (XEG.TO)
With CL.F hitting new recent 52-week highs, and investors more likely to find exposure to oil through the related equites, an analysis of the relative comparison between the two makes sense. For our purposes, we will look at CL.F vs XEG.TO. Looking specifically at a few of the larger constituents of XEG.TO, we see that Suncor (SU.TO) has a year-to-date return of -3.79% with Crescent Point (CPG.TO) having a year-to-date return of -14.93%. All the while CL.F is just about flat on the year. So far this year, the commodity is outperforming the equities at this point.
This is apparent when we look at the relative strength comparison chart of CL.F vs XEG.TO. Since July 2016 and through the end of August 2016, we witnessed the relative outperformance of the oil related equities vs the commodity itself. However, since the end of August, we can see that the rising columns of X’s is outpacing the falling columns of O’s. Having hit a rather material resistance level in this comparison analysis, a break out continuing to the upside would signal continued outperformance of the commodity vs equities. It should be noted that a break out to the up side does not necessarily mean rising commodity or equity prices, rather a relative outperformance, even if both are negative.
Please note that a 1% box size was used in this comparison analysis. We did this to look at a shorter time frame to see more movement in the commodity and its related underlying equities.
Click on Image to Enlarge
SIACharts.com specifically represents that it does not give investment advice or advocate the purchase or sale of any security or investment. None of the information contained in this website or document constitutes an offer to sell or the solicitation of an offer to buy any security or other investment or an offer to provide investment services of any kind. Neither SIACharts.com (FundCharts Inc.) nor its third party content providers shall be liable for any errors, inaccuracies or delays in content, or for any actions taken in reliance thereon.
For a more in-depth analysis on the relative strength of the equity markets, bonds, commodities, currencies, etc. or for more information on SIACharts.com, you can contact our sales and customer support at 1-877-668-1332 or at siateam@siacharts.com.
Copyright © SIACharts.com