by Don Vialoux, Timing the Market
Pre-opening Comments for Monday February 13th
U.S. equity index futures were higher this morning. S&P 500 futures were up 5 points in pre-opening trade.
Restaurant Brands (QSR $51.42) is expected to open higher after releasing higher than consensus fourth quarter earnings and revenues.
Reynolds American (RAI $60.57) is expected to open lower after RBC Capital downgraded the stock to Sector Perform from Outperform.
Teva Pharmaceutical added $1.76 to $33.95 after reporting higher than consensus quarterly earnings and revenues.
Hasbro (HAS $97.63) is expected to open higher after Goldman Sachs initiated coverage with a Buy rating
EquityClock’s Daily Market Comment
Following is a link:
http://www.equityclock.com/2017/02/10/stock-market-outlook-for-february-13-2017/
Note seasonality charts on the Materials sector, Industrial sector, Energy sector, Emerging Markets and Canada Employment.
The Bottom Line
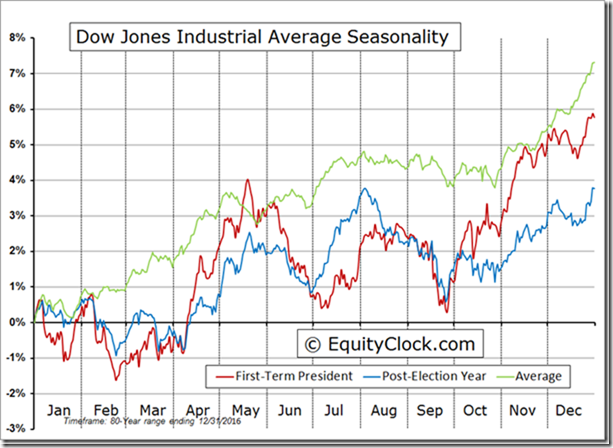
The “Trump Bump” continued last week following comments by Trump that U.S. tax reform proposals are expected to arrive during the next 2-3 weeks. Broadly based North American equity indices reached all-time highs. However, strength last week came from a narrowing number of high profile stocks (e.g. Apple). North American equity indices and economic sensitive sectors currently are overbought. History shows that upside potential between now and mid-April after election of a new President is limited. Stick with seasonal trades that are working (e.g. Industrials, Consumer Discretionary, Financials, Base Metals, Precious Metals), but be aware that technical indicators are likely to trigger profit taking between now and early March.
Economic News This Week
January Producer Prices to be released at 8:30 AM EST on Tuesday are expected to increase 0.3% versus a gain of 0.3% in December. Excluding food and energy, January Producer Prices are expected to increase 0.2% versus a gain of 0.2% in December.
January Consumer Prices to be released at 8:30 AM EST on Wednesday are expected to increase 0.2% versus a gain of 0.2% in December. Excluding food and energy, January Consumer Prices are expected to increase 0.3% versus a gain of 0.3% in December.
February Empire State Manufacturing Index to be released at 8:30 AM EST on Wednesday is expected to increase to 7.0 from 6.5 in January.
January Retail Sales to be released at 8:30 AM EST on Wednesday are expected to increase 0.1% versus a gain of 0.6% in December. Excluding auto sales, January Retail Sales are expected to increase 0.4% versus a gain of 0.2% in December
January Capacity Utilization to be released at 9:15 AM EST on Wednesday is expected to remain unchanged from December at 75.5%. January Industrial Production is expected to remain unchanged versus a gain of 0.8% in December
December Business Inventories to be released at 10:00 AM EST on Wednesday are expected to increase 0.4% versus a gain of 0.7% in November
January Housing Starts to be released at 8:30 AM EST on Thursday are expected to slip to 1,220,000 units from 1,226,000 units in December.
Weekly Initial Jobless Claims to be released at 8:30 AM EST on Thursday are expected to increase to 245,000 from 234,000 last week.
February Philly Fed Index to be released at 8:30 AM EST on Thursday is expected to slip to 17.5 from 23.6 in January.
January Leading Economic Indicators to be released at 10:00 AM EST on Friday are expected to increase 0.5% versus a gain of 0.5% in December.
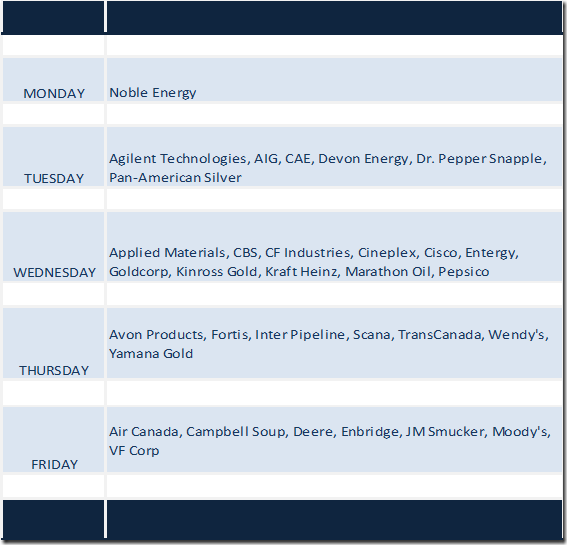
Earnings News This Week
Observations
Technical action by S&P 500 stocks last week was mixed last week despite new all-time highs set by the Dow Jones Industrial Average, S&P 500 Index and NASDAQ Composite Index. A 2.8% gain by Apple was a major reason for the all-time highs. Thirty one S&P 500 stocks broke intermediate resistance levels and 22 stocks broke intermediate support. Number of stocks in an intermediate uptrend slipped last week to 306 from 311, number of stocks in a neutral trend increased to 66 from 60 and number of stocks in an intermediate downtrend slipped to 128 from 129. The Up/Down ratio eased last week to (206/128=) 2.38 from 2.41.
Short term technical indicators (momentum, 20 day moving average) for U.S. and Canadian equity markets and economic sensitive sectors turned higher last week and are overbought, but have yet to show signs of peaking.
Intermediate term technical indicators (e.g. Percent above 50 and 200 day moving averages, Bullish Percent Index) became more overbought last week.
Notably higher last week were commodity sensitive equities on both sides of the border (base metals, lumber, fertilizers). The long-suffering energy sector finally showed early signs of bottoming. Historically, oil and gas exploration stocks in the sector on both sides of the border turn seasonally positive at the end of January for a move higher to early May. They are late this year. Strength in the sector late last week was related to colder and wetter than average weather in the northern U.S. states and southern Canada as well as confirmation that OPEC is complying with its promise to curtail oil production.
Fourth quarter reports for S&P 500 companies released to date has been higher than consensus (as usual). 71% have reported to date: 67% beat consensus earnings and 52% beat consensus revenues. Blended earnings are up 5.0% (versus 4.6% last week) and blended revenues are up 5.0% (versus 4.6% last week). Another 54 S&P 500 companies are scheduled to release results this week (including one Dow Jones Industrial Average company).
Prospects beyond the fourth quarter remain encouraging, but at a diminished level. 57 S&P 500 companies have issued negative first quarter guidance and 25 companies have issued positive guidance. Consensus for first quarter results on a year-over-year basis calls for a 9.9% increase in earnings (down from 10.8% last week) and a 7.5% increase in revenues (down from 7.6% last week. Consensus for second quarter results calls for a 9.1% increase in earnings (down from 9.6% last week) and a 5.5% increase in revenues (same as last week). Consensus for 2017 results calls for a 10.3% increase in earnings (down from 11.1% last week) and a 5.6% in revenues (down from 5.8% last week).
Fourth quarter results from TSX 60 companies start to pour in this week. Focus is on reports by gold, base metal and energy companies.
Economic news this week is expected to show a slightly diminished growth rate by the U.S. economy.
Weather is expected to have an impact. Snow storms and colder weather relative to last year at this time is having a negative impact on U.S. and Canadian economies.
U.S. equity markets have a history of moving flat to slightly lower until April in Post Presidential Election years.
U.S. equity markets are closed on February 20th for Presidents’ Day.
Equity Indices and Related ETFs
Daily Seasonal/Technical Equity Trends for February 10th 2017
Green: Increase from previous day
Red: Decrease from previous day
Calculating Technical Scores
Technical scores are calculated as follows:
Intermediate Uptrend based on at least 20 trading days: Score 2
Higher highs and higher lows
Intermediate Neutral trend: Score 0
Not up or down
Intermediate Downtrend: Score -2
Lower highs and lower lows
Outperformance relative to the S&P 500 Index: Score: 2
Neutral Performance relative to the S&P 500 Index: 0
Underperformance relative to the S&P 500 Index: Score –2
Above 20 day moving average: Score 1
At 20 day moving average: Score: 0
Below 20 day moving average: –1
Up trending momentum indicators (Daily Stochastics, RSI and MACD): 1
Mixed momentum indicators: 0
Down trending momentum indicators: –1
Technical scores range from -6 to +6. Technical buy signals based on the above guidelines start when a security advances to at least 0.0, but preferably 2.0 or higher. Technical sell/short signals start when a security descends to 0, but preferably -2.0 or lower.
Long positions require maintaining a technical score of -2.0 or higher. Conversely, a short position requires maintaining a technical score of +2.0 or lower.
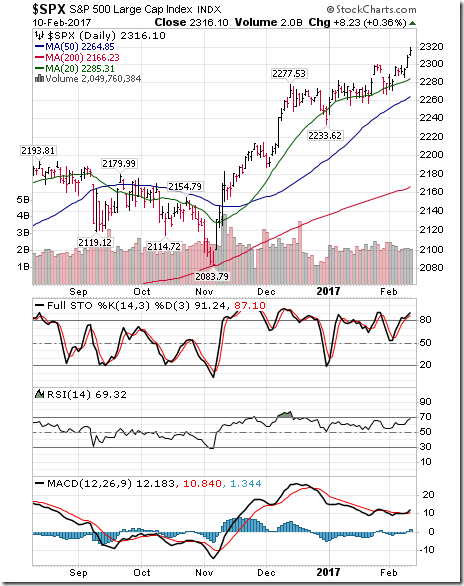
The S&P 500 Index gained 23.54 points (1.03%) last week for the period from Monday’s close to Friday’s close. Intermediate uptrend was confirmed with the Index reaching an all-time high. The Index remains above its 20 day moving average. Short term momentum indicators are trending up.
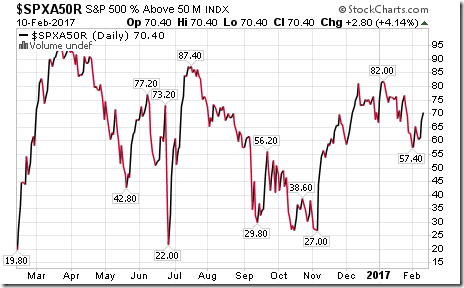
Percent of S&P 500 stocks trading above their 50 day moving average increased last week to 70.40% from 62.00%. Percent remains intermediate overbought.
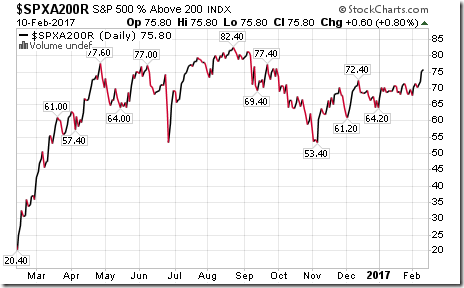
Percent of S&P 500 stocks trading above their 200 day moving average increased last week to 75.80% from 70.40%. Percent remains intermediate overbought.
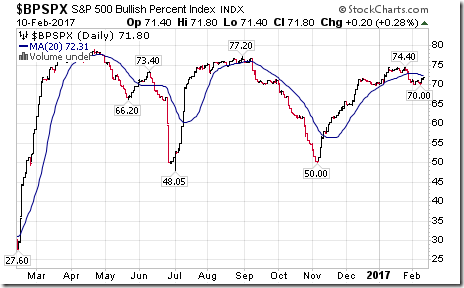
Bullish Percent Index for S&P 500 stocks increased last week to 71.80% from 71.00%, but remained below its 20 day moving average. The Index remains intermediate overbought.
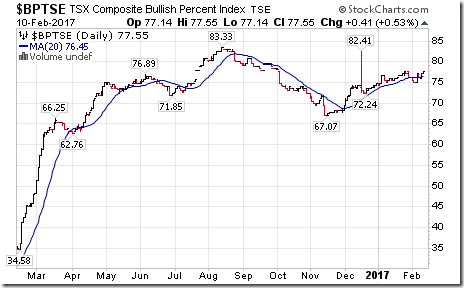
Bullish Percent Index for TSX Composite stocks increased last week to 77.55% from 77.14% and remained above its 20 day moving average. The Index remains intermediate overbought.
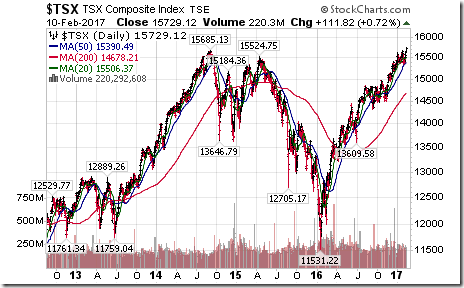
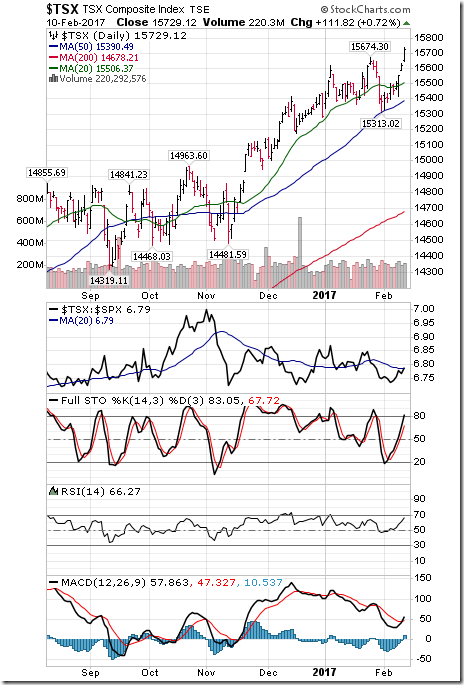
The TSX Composite Index gained 272.18 points (1.76%) last week. Intermediate uptrend was confirmed on a move above 15,674.30 to an all-time high (Score: 2). Strength relative to the S&P 500 Index changed to Neutral from Negative (Score: 0). The Index moved above its 20 day moving average (Score: 1). Short term momentum indicators are trending up (Score: 1). Technical score increased last week to 4 from -2.
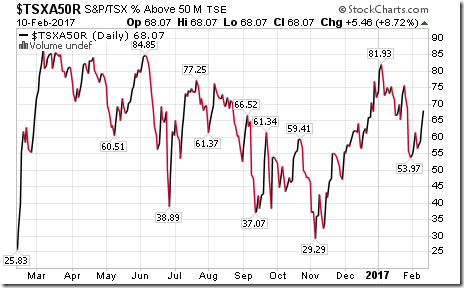
Percent of TSX stocks trading above their 50 day moving average increased last week to 68.07% from 56.54%. Percent remains intermediate overbought.
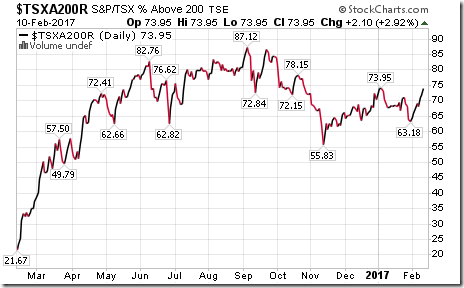
Percent of TSX stocks trading above their 200 day moving average increased last week to 73.95% from 69.20%. Percent remains intermediate overbought.
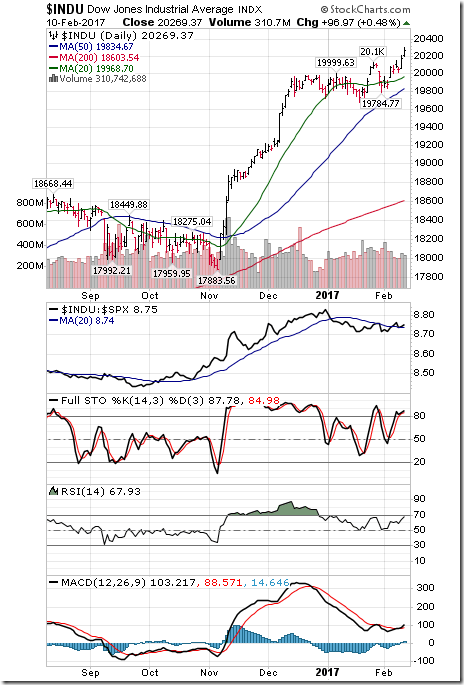
The Dow Jones Industrial Average gained 216.95 points (1.08%) last week. Intermediate uptrend was confirmed on a move above 20,100 to an all-time high. Strength relative to the S&P 500 Index remains Neutral. The Average remained above its 20 day moving average. Short term momentum indicators are trending up. Technical score increased last week to 4 from 2.
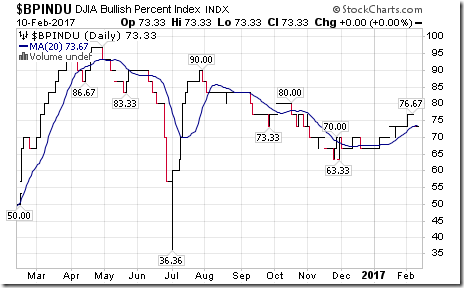
Bullish Percent Index for Dow Jones Industrial Average stocks slipped last week to 73.33% from 76.67% and matched its 20 day moving average. The Index remains intermediate overbought.
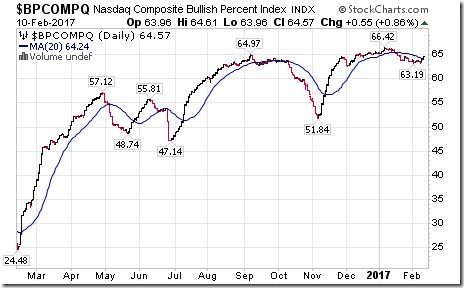
Bullish Percent Index for NASDAQ Composite stocks increased last week to 64.57% from 63.68% and moved above its 20 day moving average. The Index remains intermediate overbought.
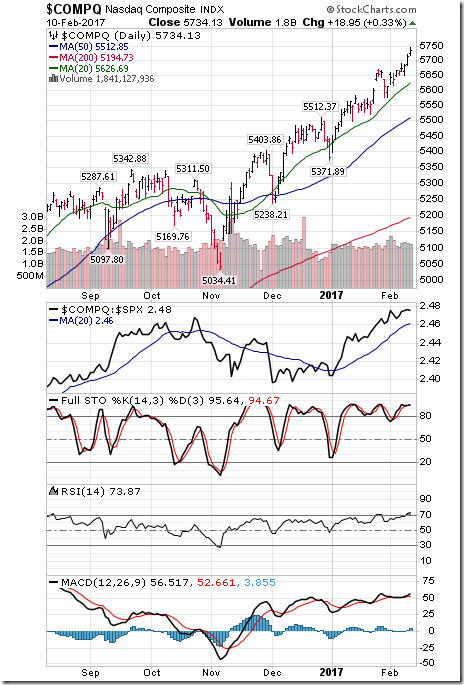
The NASDAQ Composite Index gained 70.58 points (1.25%) last week. Intermediate trend remains up with the Index at an all-time high. Strength relative to the S&P 500 Index remains Positive. The Index remains above its 20 day moving average. Short term momentum indicators are trending up. Technical score remained last week at 6.
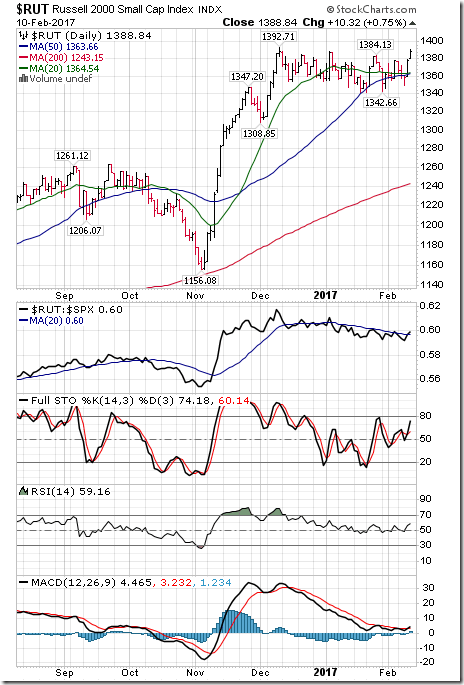
The Russell 2000 Index gained 22.18 points (1.62%) last week. Intermediate trend remains down. Strength relative to the S&P 500 Index changed to Neutral from Negative. The Index remains above its 20 day moving average. Short term momentum indicators are trending up. Technical score increased last week to 0 from -4.
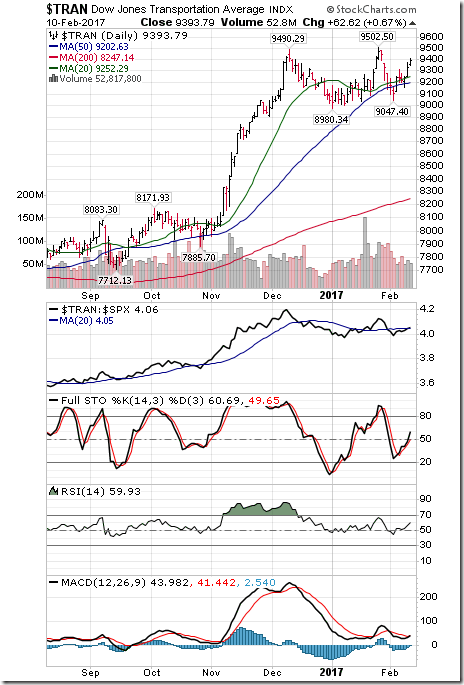
The Dow Jones Transportation Average increased 161.97 points (1.75%) last week. Intermediate trend remains up. Strength relative to the S&P 500 Index remained Neutral. The Average remains above its 20 day moving average. Short term momentum indicators are trending up. Technical score increased last week to 4 from 2.
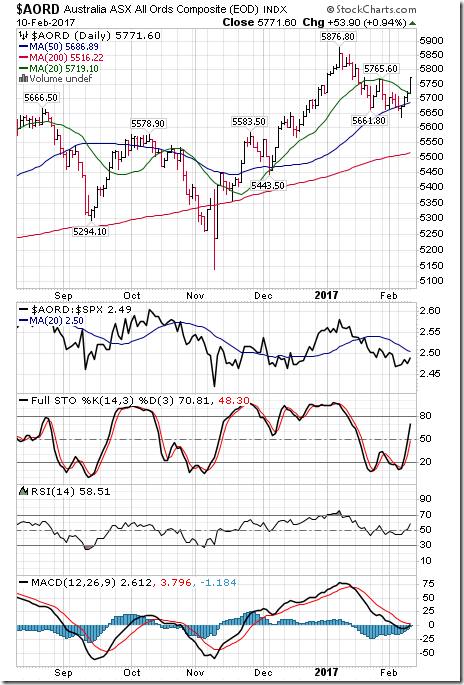
The Australia All Ordinaries Composite Index added 106.20 points (1.87%) last week. Intermediate trend remains up. Strength relative to the S&P 500 Index remains Negative. The Index moved above its 20 day moving average. Short term momentum indicators are trending up. Technical score increased to 0 from -2 last week.
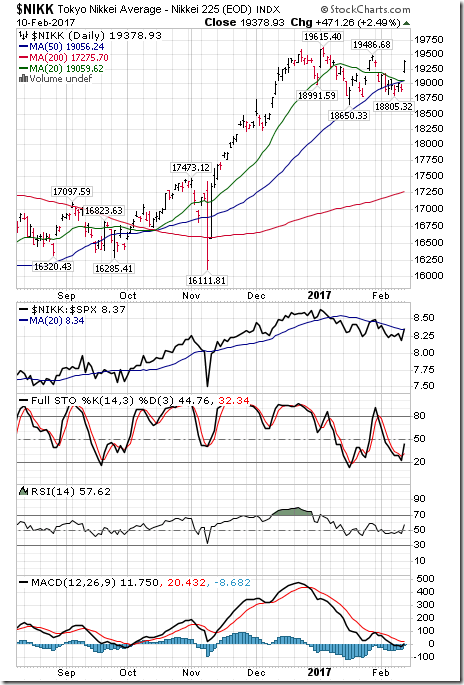
The Nikkei Average gained 402.22 points (2.12%) last week. Intermediate trend remains down. Strength relative to the S&P 500 Index remained at Neutral. The Average moved above its 20 day moving average. Short term momentum indicators are trending up. Technical score increased last week to 0 from -4.
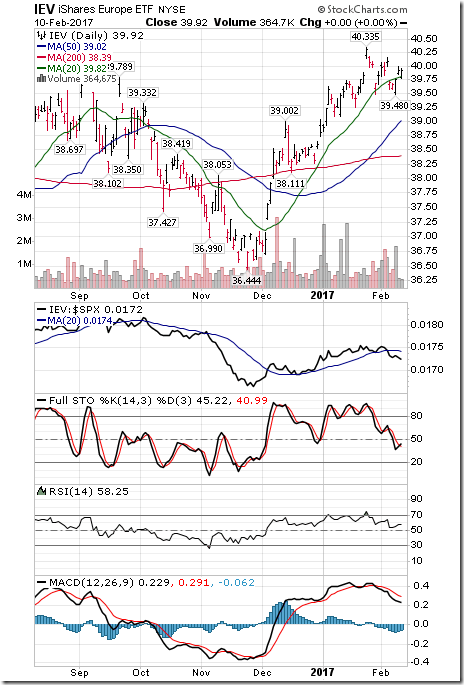
Europe iShares gained $0.21 (0.53%) last week. Intermediate trend remains up. Strength relative to the S&P 500 Index changed to Negative from Neutral. Units moved above their 20 day moving average. Short term momentum indicators are trending down. Technical score remained last week at 0.
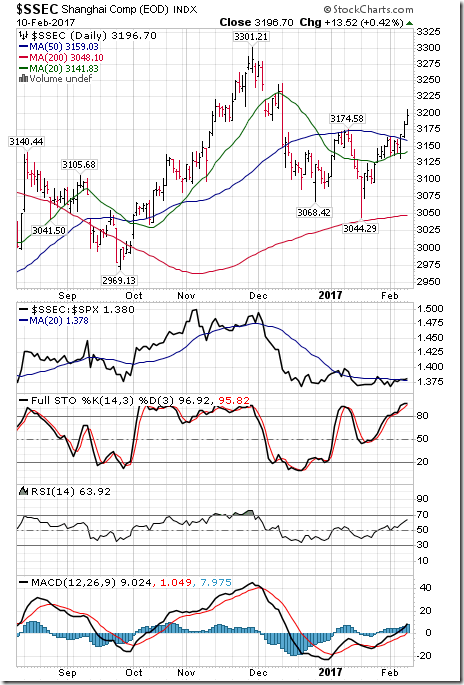
The Shanghai Composite Index gained 39.72 points (1.26%) last week. Intermediate trend changed last week to Neutral from Down on a move above 3,174.58. Strength relative to the S&P 500 Index remains Neutral. The Index remains above its 20 day moving average. Short term momentum indicators are trending up. Technical score increased last week to 2 from 0.
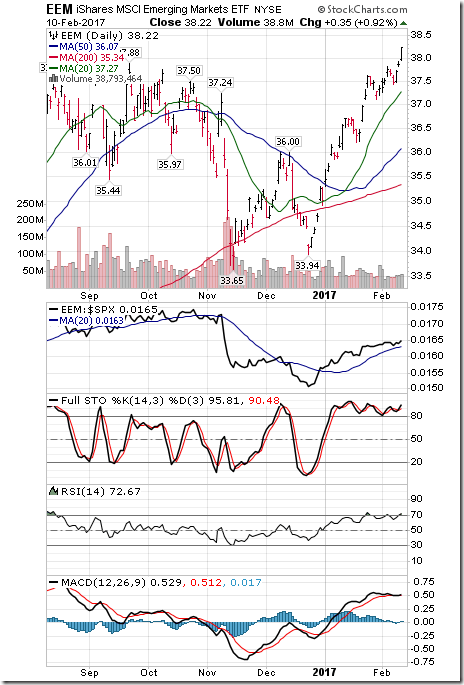
Emerging Markets iShares gained $0.56 (1.49%) last week. Intermediate trend remains up. Strength relative to the S&P 500 Index remains Positive. Units remain above its 20 day moving average. Short term momentum indicators are trending up. Technical score increased last week to 6 from 4.
Currencies
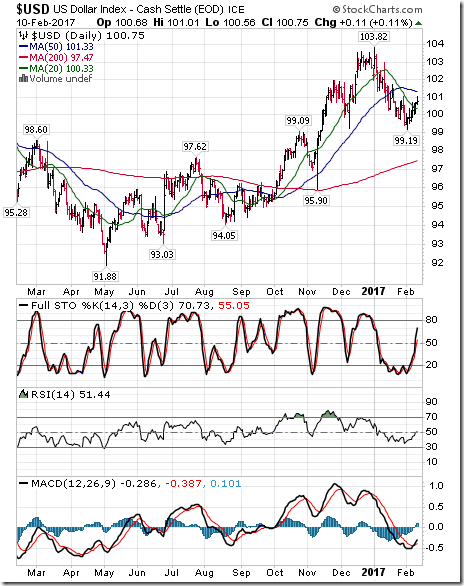
The U.S. Dollar Index added 0.93 (0.93%) last week. Intermediate trend remains up. The Index moved above its 20 day moving average. Short term momentum indicators are trending up.
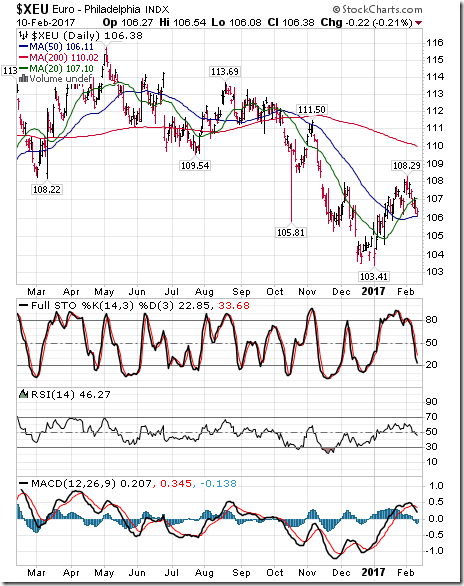
The Euro dropped 1.16 (1.08%) last week. Intermediate trend remains down. The Euro moved below its 20 day moving average. Short term momentum indicators are trending down.
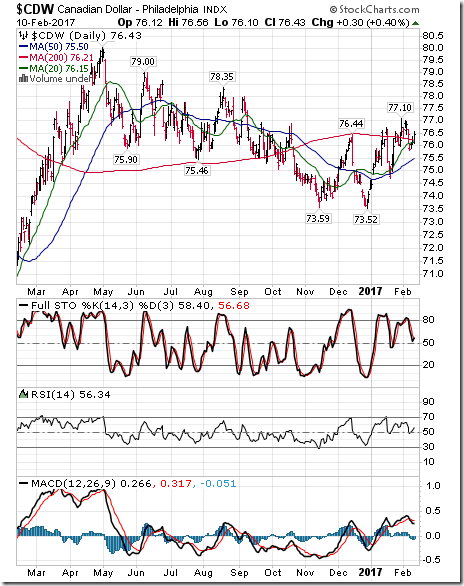
The Canadian Dollar was unchanged last week. Intermediate trend remains Neutral. The Canuck Buck remains above its 20 day moving average. Short term momentum indicators are trending down.
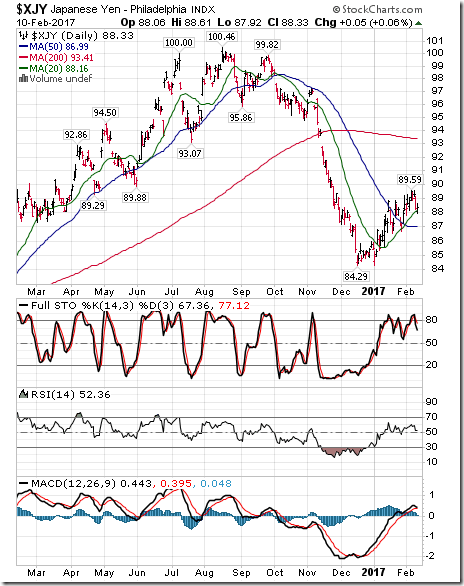
The Japanese Yen dropped 1.22 (1.36%) last week. Intermediate trend remains down. The Yen remains above its 20 day moving average. Short term momentum indicators are trending down.
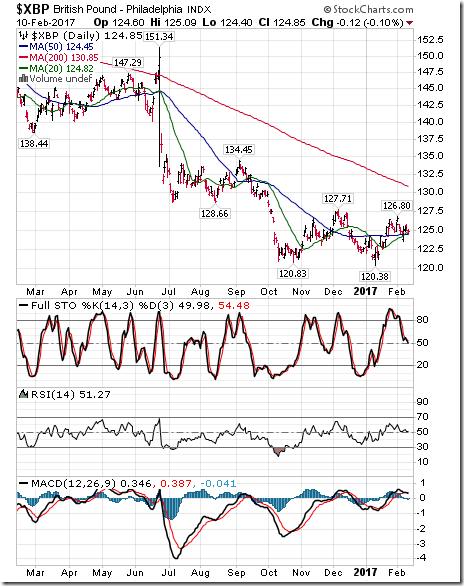
The British Pound added 0.14 (0.11%) last week. Intermediate trend remains down. The Pound remains above its 20 day moving average. Short term momentum indicators are trending down.
Commodities
Daily Seasonal/Technical Commodities Trends for February 10th 2017
Green: Increase from previous day
Red: Decrease from previous day
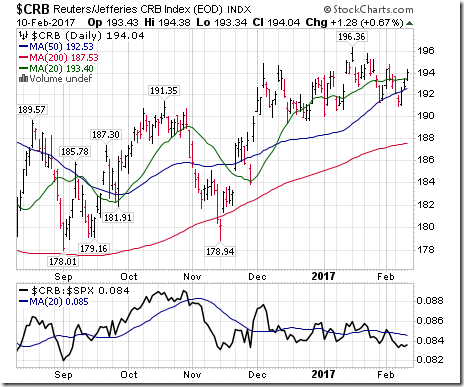
The CRB Index added 1.88 points (0.98%) last week. Intermediate trend remains up. Strength relative to the S&P 500 Index remains Negative. The Index moved above its 20 day moving average on Friday. Short term momentum indicators have turned up. Technical score increased last week to 2 from -2.
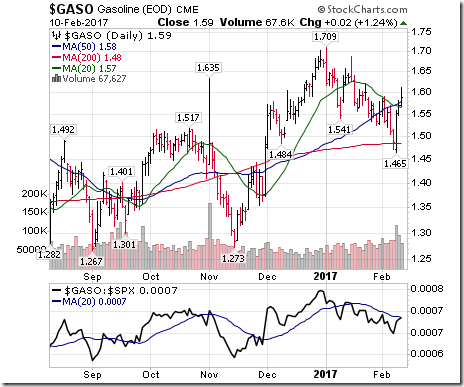
Gasoline jumped $0.08 per gallon (5.30%) last week. Intermediate trend remains down. Strength relative to the S&P 500 Index changed to Neutral from Negative. Gas moved above its 20 day moving average. Short term momentum indicators are trending up. Technical score increased last week to 0 from -6.
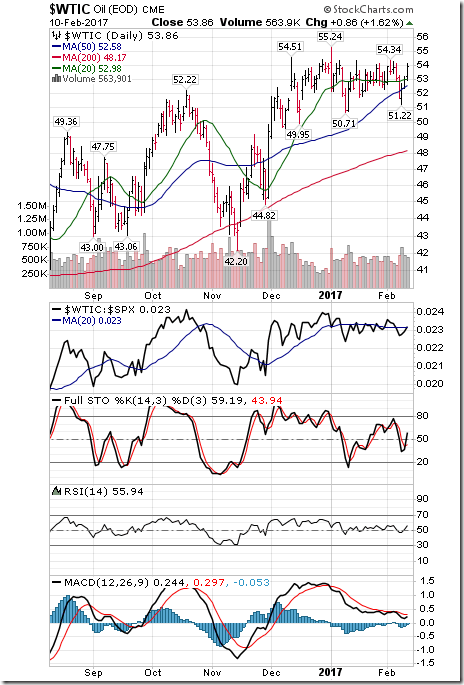
Crude Oil added $0.87 per barrel (1.60%) last week. Intermediate trend remain up. Strength relative to the S&P 500 Index remains Neutral. Crude remained above its 20 day moving average. Short term momentum indicators have turned up. Technical score last week remained at 4.
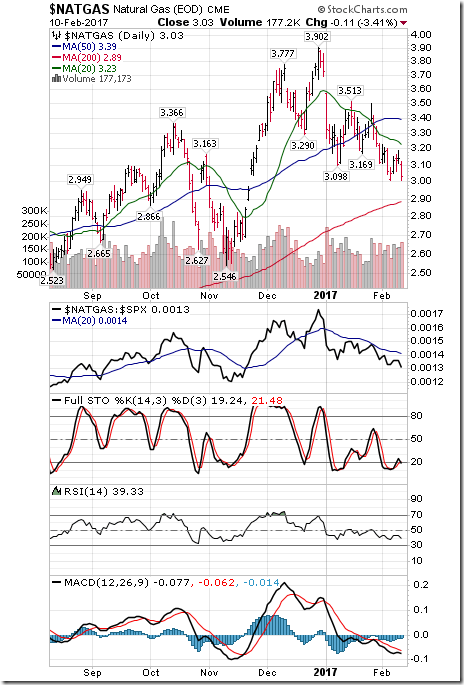
Natural Gas slipped $0.02 (0.66%) last week. Intermediate trend remains down. Strength relative to the S&P 500 Index remains Negative. “Natty” remains below its 20 day moving average. Short term momentum indicators are trending up. Technical score improved last week to -4 from -6.
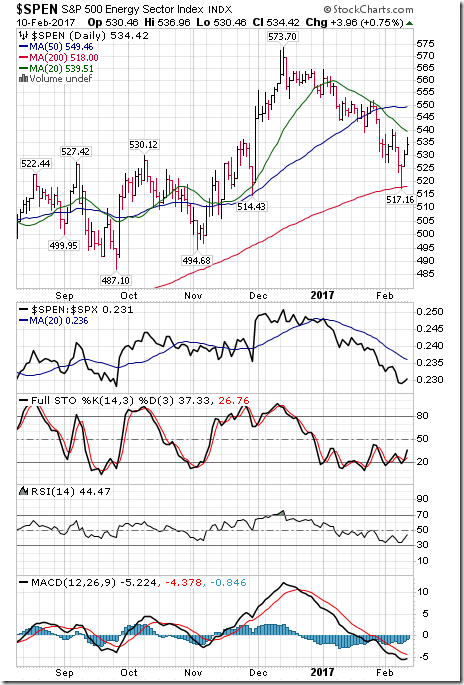
The S&P Energy Index added 1.15 points (0.22%) last week. Intermediate trend remains down. Strength relative to the S&P 500 Index remains Negative. The Index remains below its 20 day moving average. Short term momentum indicators have just turned up. Technical score increased last week to -4 from -6.
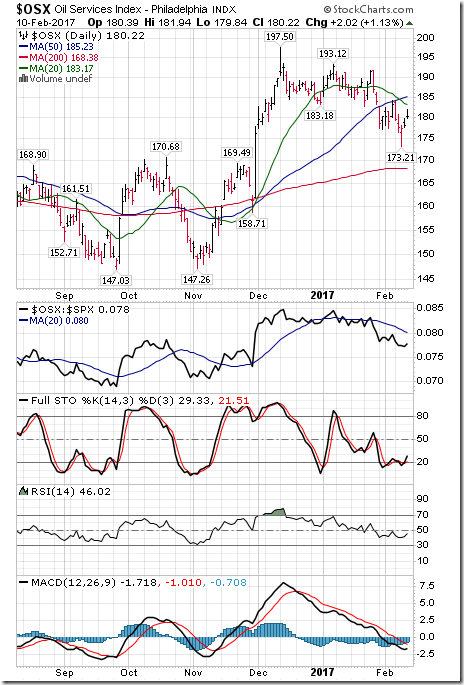
The Philadelphia Oil Services Index added 0.70 (0.39%) last week. Intermediate trend remains down. Strength relative to the S&P 500 Index remains Negative. The Index remains below its 20 day moving average. Short term momentum indicators have just turned up. Technical score increased last week to -4 from -6.
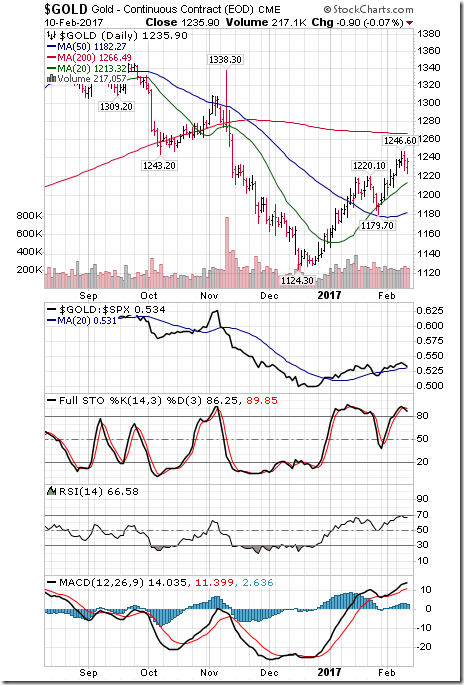
Gold added $3.80 per ounce (0.31%) last week. Intermediate trend remains up. Strength relative to the S&P 500 Index remains Positive. Gold remains above its 20 day moving average. Short term momentum indicators are trending up. Technical score remained last week at 6.
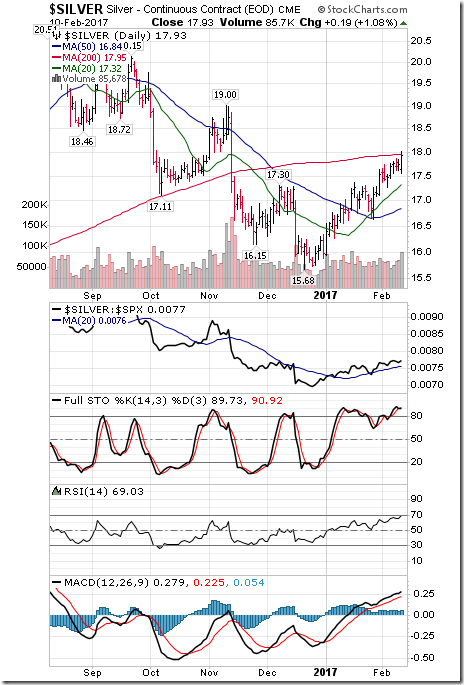
Silver gained $0.24 per ounce (1.36%) last week. Intermediate trend remains up. Strength relative to the S&P 500 Index remains Positive. Silver remains above its 20 day moving average. Short term momentum indicators are trending up. Technical score remained last week at 6.
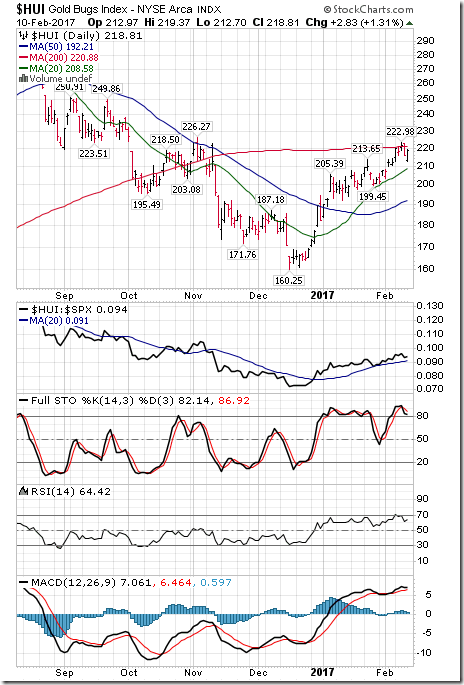
The AMEX Gold Bug Index slipped 1.11 points (0.50%) last week. Intermediate trend remains Neutral. Strength relative to the S&P 500 Index remains Positive. The Index remains above its 20 day moving average. Short term momentum indicators are trending up. Technical score remained last week at 4.
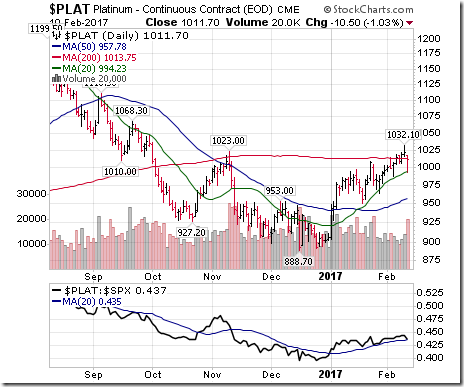
Platinum dropped $2.40 per ounce (0.24%) last week. Intermediate trend remains up. Strength relative to the S&P 500 Index remains positive. Platinum remains above its 20 day moving average. Short term momentum indicators are trending up. Technical score remains at 6.
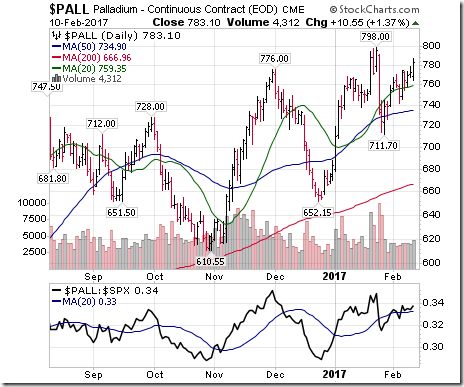
Palladium gained $8.80 per ounce (1.14%) last week. Trend remains up. Relative strength: Neutral. Trades above its 20 day MA. Momentum: positive. Score remained at 4
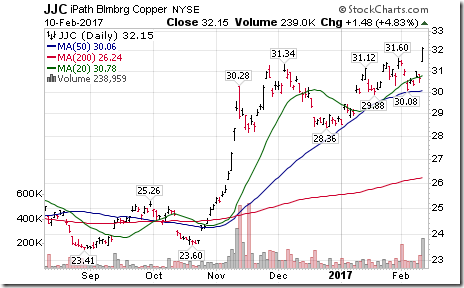
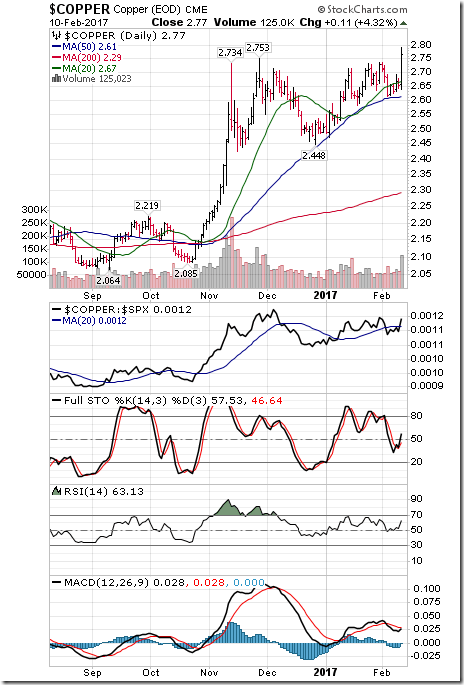
Copper gained $0.12 per lb (4.53%) last week. Intermediate uptrend was confirmed on Friday on a move above $2.753. Strength relative to the S&P 500 Index turned Positive from Neutral. Copper moved above its 20 day moving average. Short term momentum indicators are trending up. Technical score increased last week to 6 from 2.
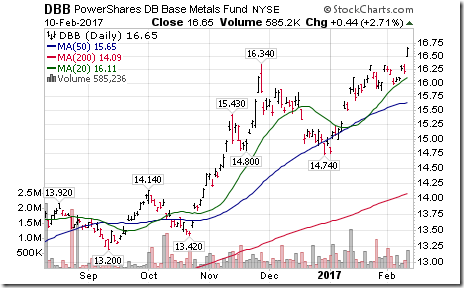
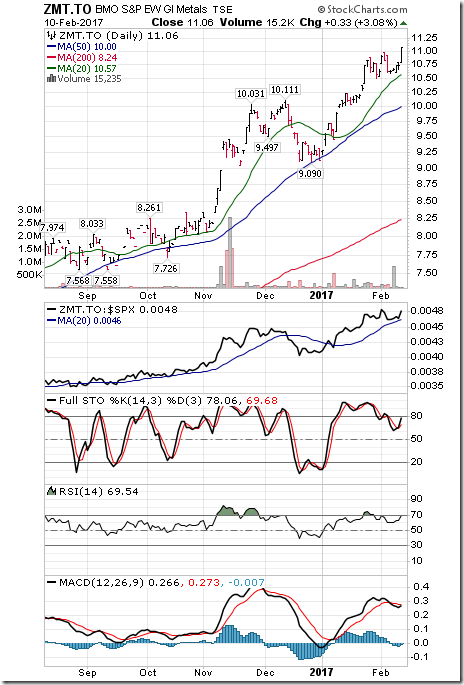
Base Metal ETF gained $0.44 (4.14%) last week. Intermediate trend remains up. Strength relative to the S&P 500 Index remains Positive. Units remained above their 20 day moving average. Short term momentum indicators are trending up. Technical score increased last week to 6 from 4.
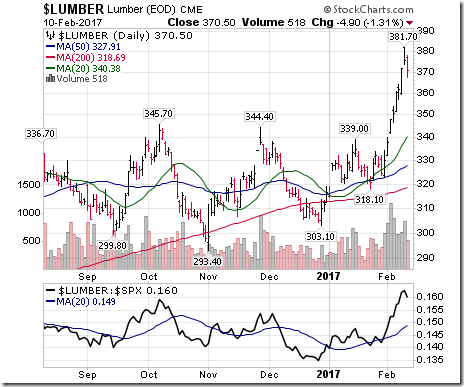
Lumber gained $10.40 (2.89%) last week. Trend remains up. Relative strength remains Positive. Trades above its 20 day moving average. Momentum remains positive. Score: 6
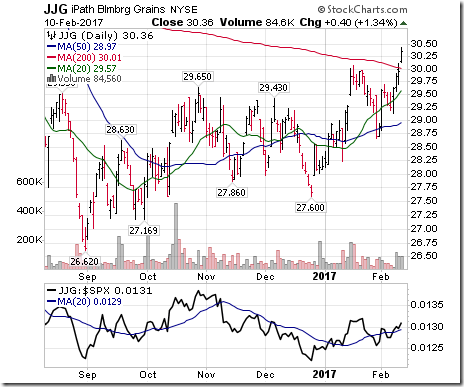
The Grain ETN added $1.10 (3.76%) last week. Trend remains up. Strength relative to the S&P 500 Index turned Positive. Units remain above their 20 day moving average. Short term momentum indicators are trending up. Technical score increased last week to 6 from 0.
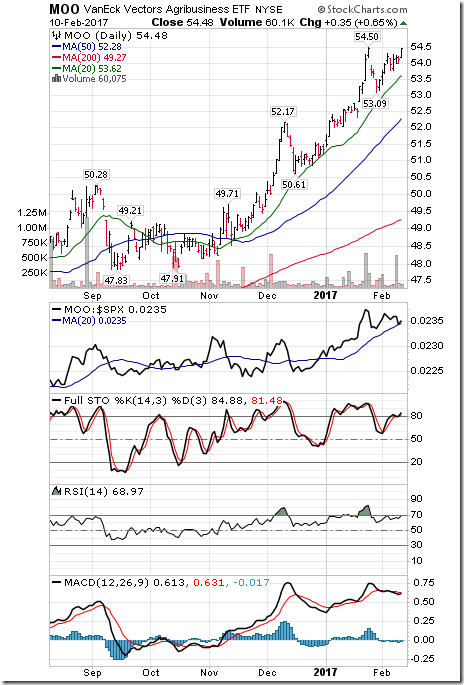
The Agriculture ETF gained $0.51 (0.94%) last week. Strength relative to the S&P 500 Index remains Positive. Units remain above their 20 day moving average. Short term momentum indicators have turned back up. Technical score increased to 6 from 4.
Interest Rates
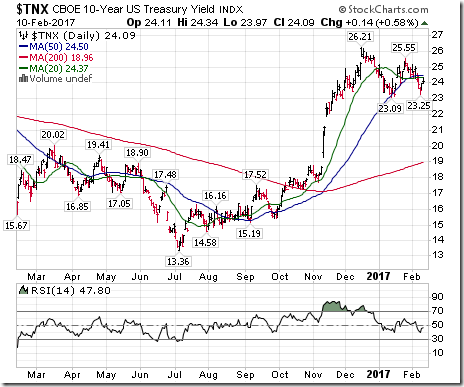
The yield on 10 year Treasuries slipped 0.04 (0.17%) last week. Intermediate trend remains up. Yield moved below its 20 day moving average. Short term momentum indicators are trending down.
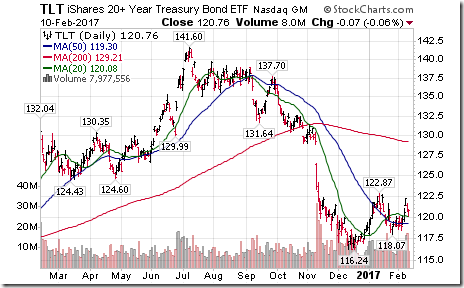
Price of the long term Treasury ETF added $1.04 (0.87%) last week. Intermediate trend remains down. Units moved above their 20 day moving average.
Volatility
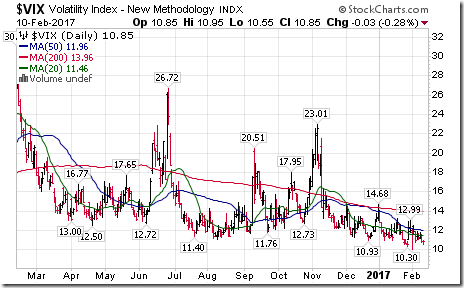
The VIX Index slipped 0.52 (4.57%) last week. Intermediate trend remains down. The Index remains below its 20 day moving average.
Sectors
Daily Seasonal/Technical Sector Trends for February 10th 2017
Green: Increase from previous day
Red: Decrease from previous day
StockTwits Released on Friday
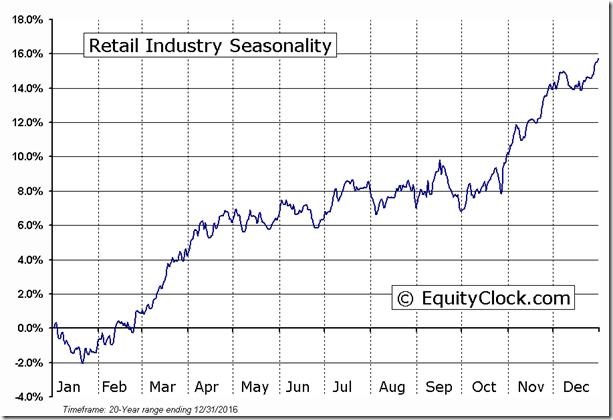
Retail industry ready for a move higher within its period of seasonal strength.
Technical action by S&P 500 stocks to 10:30: Bullish. Breakouts: $IPG $AON $CBG $IVZ $NLSN $HD $WY $LLL. No breakdowns
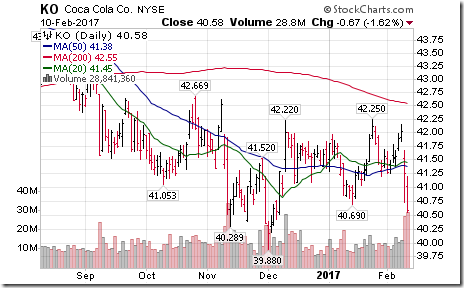
Editor’s Note: After 10:30 AM EST, breakouts included ACN, PXD and WAT. Breakdown: KO
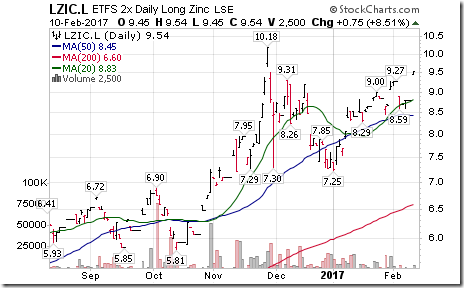
Base metal prices move higher following better than expected China trade report.
Base metals ETN $DBB (1/3 copper zinc aluminum) moved above $16.34 extending intermediate uptrend.
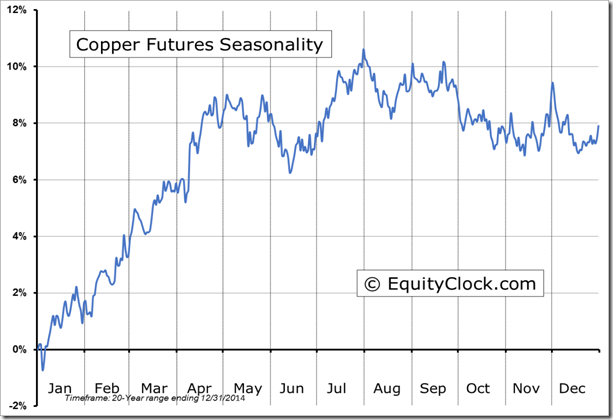
‘Tis the season for strength in copper prices to early May $JJC
Grain prices continue to surge. Wheat ETN moved above $7.37 extending intermediate uptrend.
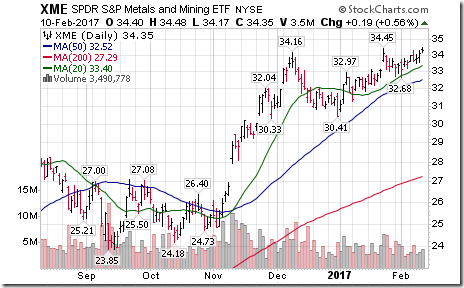
Metals & Mining SPDRs responding to higher base metal prices $XME. ’Tis the season for strength to early May.
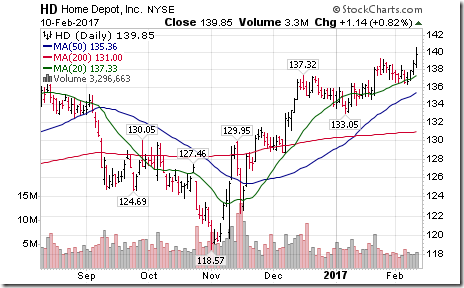
Home Depot $HD, a Dow Jones Industrial stock moved above $139.37 extending intermediate uptrend.
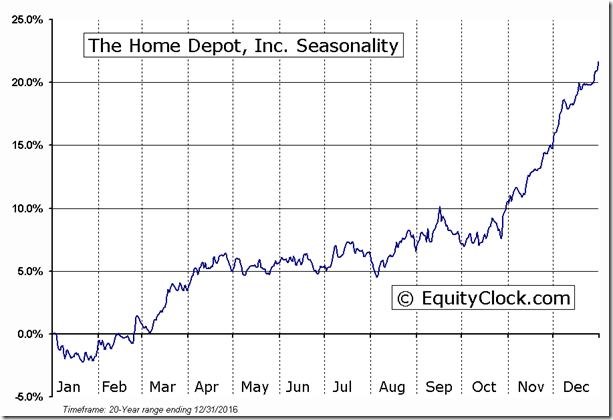
‘Tis the season for strength in Home Depot to late April.
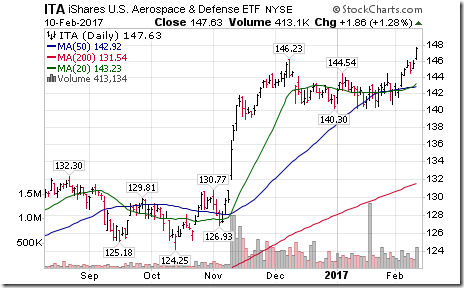
Aerospace and Defence stocks and related ETFs breaking to new highs. $ITA $PPA
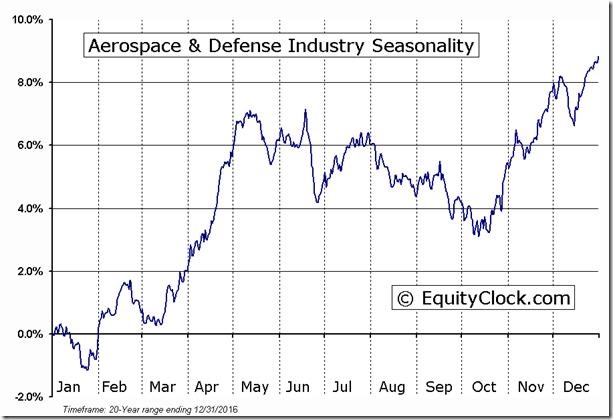
‘Tis the season for strength in the Aerospace & Defence sector to mid-May! $ITA $PPA.
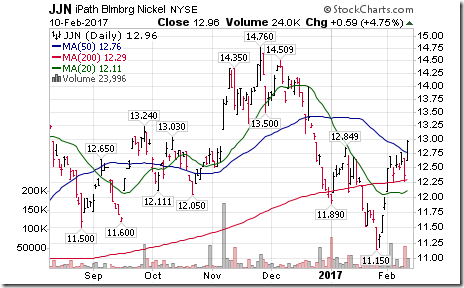
Among base metal prices, nickel also is surging $JJN
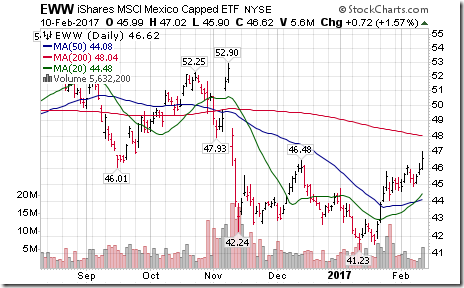
Interesting and surprising breakout by Mexico iShares $EWW above $46.48.
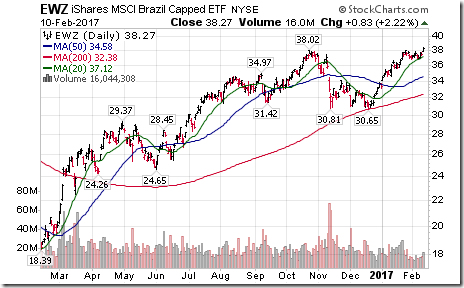
Commodity sensitive Brazil iShares moved above $38.02 to a 27 month high extending an intermediate uptrend.
TSX Composite Index moved above 15,685.13 to an all-time high extending intermediate uptrend.
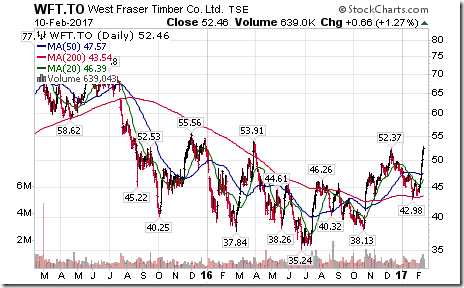
More lumber stocks breaking to new highs: $WY $WFT.CA.
Coca Cola $KO, a Dow Jones Industrial stock moved below support at $40.69 establishing a neutral trend.
WALL STREET RAW RADIO WITH HOST, MARK LEIBOVIT – FEBRUARY 11, 2017
WITH GUESTS ROB LEVY, HENRY WEINGARTEN, HARRY BOXER AND SINCLAIR NOE.
Disclaimer: Seasonality and technical ratings offered in this report and www.equityclock.com are for information only. They should not be considered as advice to purchase or to sell mentioned securities. Data offered in this report is believed to be accurate, but is not guaranteed
Copyright © Timing the Market


![clip_image002[6] clip_image002[6]](https://advisoranalyst.com/wp-content/uploads/HLIC/ab7ae0d28c9bccb4bcd73d933812c2c1.png)
![clip_image002[8] clip_image002[8]](https://advisoranalyst.com/wp-content/uploads/HLIC/081e3203ac9ab84de0962761c71f192f.png)
![clip_image002[12] clip_image002[12]](https://advisoranalyst.com/wp-content/uploads/HLIC/34b139c552216ce2909aeabcdf9df051.png)
