by Ryan Detrick, LPL Research
After 10 days of the year, the S&P 500 is up 1.3%, which might not sound like much, but it is a lot better than the down 8.0% after the first 10 days of 2016. As we mentioned yesterday, the Dow is in a historically tight trading range over the past month, and today we will take a look at some interesting stats from the S&P 500 recently.
- Since Thanksgiving 2016, the S&P 500 has alternated between higher and lower for the week for eight consecutive weeks—for only the tenth time since 1928.* There was a record streak of 11 alternating weeks back in 2015.
- The S&P 500 hasn’t closed more than 1.5% away from an all-time high for 46 consecutive days, the longest streak since 72 in a row in summer 2014 and early 1995.
- On an intraday basis, the S&P 500 hasn’t had a 1% intraday move for 21 consecutive days—the longest streak since 25 in a row in late 2014.
- Over the past month (21 trading days), the S&P 500 has traded in a range of only 1.7% (using closing prices). Other times we’ve seen ranges like this were September 2016, September 2014, January 2014, April 2013, September 2012, and January 2007. In other words, what we’ve seen over the past month is very rare, and usually we see surges in volatility over the coming months after periods like now.
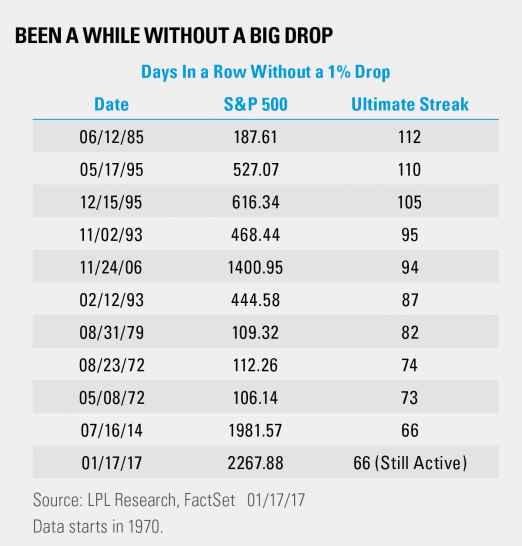
- The S&P 500 has now gone 66 consecutive days without a 1% drop, tying the 66 days from summer 2014.
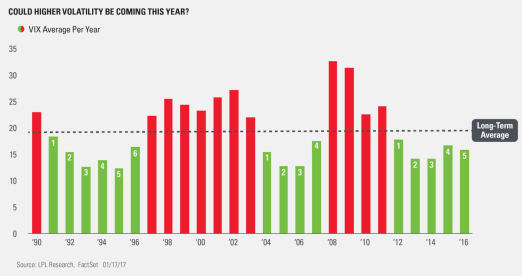
- Last, the CBOE Volatility Index (VIX) was beneath its long-term average of 19.7 for the fifth consecutive year in 2016. As this chart shows, volatility rarely stays this low for this long. Per Ryan Detrick, Senior Market Strategist, “Of course, it doesn’t mean volatility can’t be beneath the long-term average for another year or two, but be aware this period of a lull in volatility is getting long in the tooth. Coupled with economic uncertainty, despite some upside to growth prospects with the new administration, this further increases the chances of much more volatility later this year.”
IMPORTANT DISCLOSURES
*Please note: The modern design of the S&P 500 stock index was first launched in 1957. Performance back to 1928 incorporates the performance of predecessor index, the S&P 90.
Past performance is no guarantee of future results.
The opinions voiced in this material are for general information only and are not intended to provide or be construed as providing specific investment advice or recommendations for any individual security.
The economic forecasts set forth in the presentation may not develop as predicted.
Indices are unmanaged and cannot be invested into directly. Unmanaged index returns do not reflect fees, expenses, or sales charges. Index performance is not indicative of the performance of any investment.
Investing in stock includes numerous specific risks including: the fluctuation of dividend, loss of principal and potential illiquidity of the investment in a falling market.
There is no guarantee that a diversified portfolio will enhance overall returns or outperform a nondiversified portfolio. Diversification does not ensure against market risk.
The S&P 500 Index is a capitalization-weighted index of 500 stocks designed to measure performance of the broad domestic economy through changes in the aggregate market value of 500 stocks representing all major industries.
The VIX is a measure of the volatility implied in the prices of options contracts for the S&P 500. It is a market-based estimate of future volatility. When sentiment reaches one extreme or the other, the market typically reverses course. While this is not necessarily predictive, it does measure the current degree of fear present in the stock market.
This research material has been prepared by LPL Financial LLC.
To the extent you are receiving investment advice from a separately registered independent investment advisor, please note that LPL Financial LLC is not an affiliate of and makes no representation with respect to such entity.
Not FDIC/NCUA Insured | Not Bank/Credit Union Guaranteed | May Lose Value | Not Guaranteed by any Government Agency | Not a Bank/Credit Union Deposit
Securities and Advisory services offered through LPL Financial LLC, a Registered Investment Advisor Member FINRA/SIPC
Tracking #1-573170 (Exp. 1/18)


