by LPL Research
“If a tree falls in the forest and no one is around to hear it, does it make a sound?”
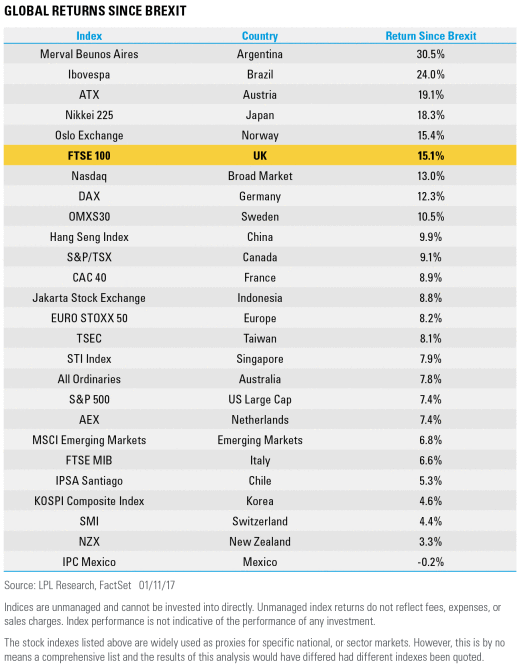
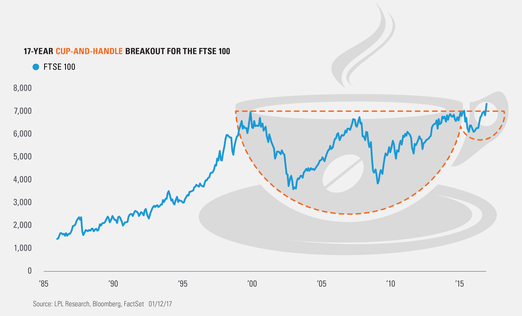
Along the same lines as above, what happens when an equity market breaks out to new highs and no one notices? Quick—how has the London FTSE 100 done since the Brexit vote? Would you believe it is one of the top-performing global stock markets in the world? Also it has broken out of a 17-year basing pattern. I’m guessing not too many people saw that happening on the night of June 23.
A month ago in Is Europe Finally On The Mend? we noted many European markets were improving technically and more strength could be possible. Since then Europe has done very well, but the FTSE 100 is the true rock star. As of Thursday, it was up a record 13 days in a row and incredibly made new highs 11 days in a row.
Per Ryan Detrick, Senior Market Strategist, “One of the better looking long-term breakouts you will ever see is the FTSE 100, yet no one is talking about it. After lagging for years, it is completing what is called a bullish cup-and-handle pattern*. This could be a great sign for British equities, possibly European equities, and potentially global equities—as it is yet another market breaking out to new highs, further confirming the global bull market.”
Copyright © LPL Research
*****
IMPORTANT DISCLOSURES
Technical Analysis is a methodology for evaluating securities based on statistics generated by market activity, such as past prices, volume and momentum, and is not intended to be used as the sole mechanism for trading decisions. Technical analysts do not attempt to measure a security’s intrinsic value, but instead use charts and other tools to identify patterns and trends. Technical analysis carries inherent risk, chief amongst which is that past performance is not indicative of future results. Technical Analysis should be used in conjunction with Fundamental Analysis within the decision making process and shall include but not be limited to the following considerations: investment thesis, suitability, expected time horizon, and operational factors, such as trading costs are examples.
* A chart pattern is a stock chart formation that creates a trading signal, or a sign of potential future price movements. A cup-and-handle pattern is considered a bullish continuation pattern and is used to identify buying opportunities.
Past performance is no guarantee of future results.
The opinions voiced in this material are for general information only and are not intended to provide or be construed as providing specific investment advice or recommendations for any individual security.
The economic forecasts set forth in the presentation may not develop as predicted.
Investing in stock includes numerous specific risks including: the fluctuation of dividend, loss of principal and potential illiquidity of the investment in a falling market.
There is no guarantee that a diversified portfolio will enhance overall returns or outperform a nondiversified portfolio. Diversification does not ensure against market risk.
Investing in foreign and emerging markets securities involves special additional risks. These risks include, but are not limited to, currency risk, geopolitical risk, and risk associated with varying accounting standards. Investing in emerging markets may accentuate these risks.
The FTSE 100 is an index of blue-chip stocks on the London Stock Exchange.
This research material has been prepared by LPL Financial LLC.
To the extent you are receiving investment advice from a separately registered independent investment advisor, please note that LPL Financial LLC is not an affiliate of and makes no representation with respect to such entity.
Not FDIC/NCUA Insured | Not Bank/Credit Union Guaranteed | May Lose Value | Not Guaranteed by any Government Agency | Not a Bank/Credit Union Deposit
Securities and Advisory services offered through LPL Financial LLC, a Registered Investment Advisor Member FINRA/SIPC
Tracking #1- 1-572125 (Exp. 1/18)


