
by Eric Bush, CFA, Gavekal Capital
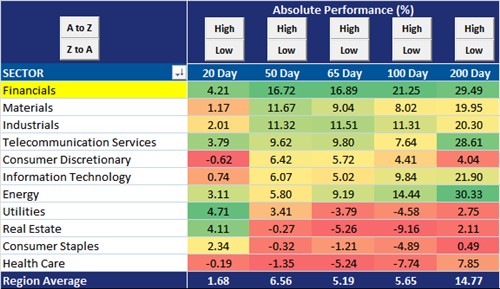
For the past couple of months, and especially since the US presidential election, US financial stocks have been on a great run. On an equal-weighted basis, US mid and large cap financial stocks are up a scorching 16.7% over the past 50 days. This group is out pacing the second best performing sector, materials, by over 5% and is outperforming the average US stock by 10%. To add another layer of perspective, over the past 50 days US health care stocks are actually down over 1%.
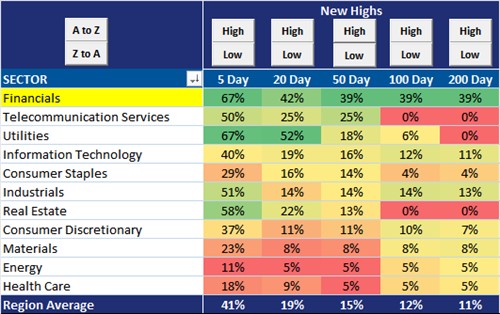
This impressive nominal performance has led to some frothy market internal statistics. For example, 39% of US financial stocks have made new 50-day highs compared to just 15% of all US stocks. Only 5% of energy and health care stocks have made new 50-day highs.
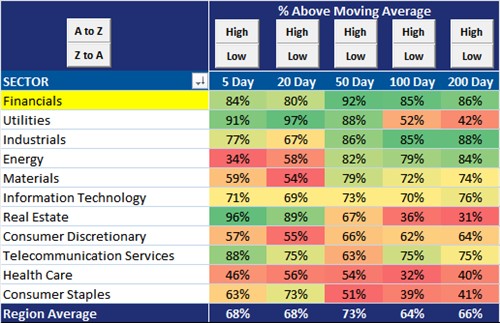
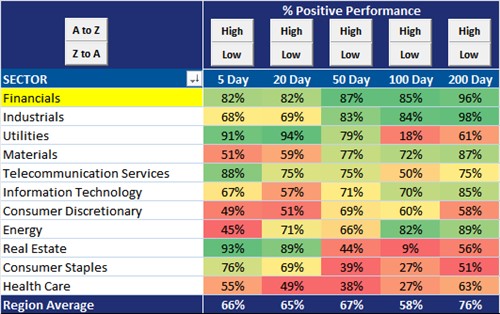
Looking at other breadth indicators, 92% of US financial stocks are trading above above the 50-day moving average, 86% are trading above the 200-day moving average and 87% have had positive performance over the past 50 days. Just 38% of health care stocks and 39% of consumer staple stocks have managed positive performance during this time.
Financials are just 6% off the four year high on average and 89% are within 20% of the four year high. Compare this to health care stock in which the average stock is off 21% from the four year high and just 58% of stocks are within 20% of the four year. Lastly, unlike financial stocks which are basically at four year highs, energy stocks seem to have a lot of runway left. Energy stocks are still 33% off the four year high and just 34% of energy stocks are within 20% of the four year high, the lowest percentage by a wide margin in the US.

Copyright © Gavekal Capital